0.00s 6.50m 0.25s 11.14m 0.50s 15.31m 0.75s 19.02.m 1.00s 22.25m 1.25s 25.02m 1.50s 27.31m 1.75s 29.14m...
|
0.00s |
6.50m |
| 0.25s | 11.14m |
| 0.50s | 15.31m |
| 0.75s | 19.02.m |
| 1.00s | 22.25m |
| 1.25s | 25.02m |
| 1.50s | 27.31m |
| 1.75s | 29.14m |
| 2.00s | 30.50m |
| 2.25s | 31.39m |
| 2.50s | 31.81m |
| 2.75s | 31.77m |
| 3.00s | 31.25m |
| 3.25s | 30.27m |
| 3.50s | 28.81m |
| 3.75s | 26.89m |
| 4.00s | 24.50m |
| 4.25s | 21.64m |
| 4.50s | 18.31m |
| 4.75s | 14.52m |
| 5.00s | 10.25m |
Astronauts on a distant planet toss a rock into the air. With the aid of a camera that takes pictures at a steady rate, they record the height of the rock as a function of time as given in the figures above.
(a) Find the average velocity of the rock in the time interval between each measurement and the next.
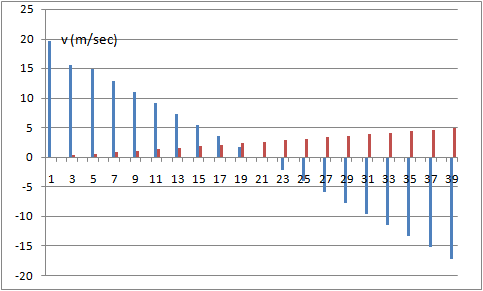
(b) Using these average velocities to approximate instantaneous velocities at the midpoint of the time intervals, make a graph of velocity as a function of time.
Homework Answers
from given chart,
| Time ( sec ) | Height ( m ) | Δh ( m ) | Δt ( sec ) | v ( m/sec ) | Mid point time |
| 0 | 6.5 | ||||
| 4.9 | 0.25 | 19.6 | 0.125 | ||
| 0.25 | 11.4 | ||||
| 3.91 | 0.25 | 15.64 | 0.375 | ||
| 0.5 | 15.31 | ||||
| 3.71 | 0.25 | 14.84 | 0.625 | ||
| 0.75 | 19.02 | ||||
| 3.23 | 0.25 | 12.92 | 0.875 | ||
| 1 | 22.25 | ||||
| 2.77 | 0.25 | 11.08 | 1.125 | ||
| 1.25 | 25.02 | ||||
| 2.29 | 0.25 | 9.16 | 1.375 | ||
| 1.5 | 27.31 | ||||
| 1.83 | 0.25 | 7.32 | 1.625 | ||
| 1.75 | 29.14 | ||||
| 1.36 | 0.25 | 5.44 | 1.875 | ||
| 2 | 30.5 | ||||
| 0.89 | 0.25 | 3.56 | 2.125 | ||
| 2.25 | 31.39 | ||||
| 0.42 | 0.25 | 1.68 | 2.375 | ||
| 2.5 | 31.81 | ||||
| -0.04 | 0.25 | -0.16 | 2.625 | ||
| 2.75 | 31.77 | ||||
| -0.52 | 0.25 | -2.08 | 2.875 | ||
| 3 | 31.25 | ||||
| -0.98 | 0.25 | -3.92 | 3.125 | ||
| 3.25 | 30.27 | ||||
| -1.46 | 0.25 | -5.84 | 3.375 | ||
| 3.5 | 28.81 | ||||
| -1.92 | 0.25 | -7.68 | 3.625 | ||
| 3.75 | 26.89 | ||||
| -2.39 | 0.25 | -9.56 | 3.875 | ||
| 4 | 24.5 | ||||
| -2.86 | 0.25 | -11.44 | 4.125 | ||
| 4.25 | 21.64 | ||||
| -3.33 | 0.25 | -13.32 | 4.375 | ||
| 4.5 | 18.31 | ||||
| -3.79 | 0.25 | -15.16 | 4.625 | ||
| 4.75 | 14.52 | ||||
| -4.27 | 0.25 | -17.08 | 4.875 | ||
| 5 | 10.25 |
Add Answer to:
0.00s
6.50m
0.25s
11.14m
0.50s
15.31m
0.75s
19.02.m
1.00s
22.25m
1.25s
25.02m
1.50s
27.31m
1.75s
29.14m...
Can you do 4,5,7,8 please Graph Practice Problems -v vs.t PHYS&114 Name: Use the graph below...
 Can you do 4,5,7,8 please
Graph Practice Problems -v vs.t PHYS&114 Name: Use the graph below to answer questions 1-11. The graph represents the velocity of a particle as a function of time. The positive direction is right and the negative direction is left. 25 20 15 10 7 8 9 o -5 -10 -15 -20 25 time (s) 1. What is the instantaneous velocity of the particle at t-3.00s? 2. What is the instantaneous velocity of the particle at...
Can you do 4,5,7,8 please
Graph Practice Problems -v vs.t PHYS&114 Name: Use the graph below to answer questions 1-11. The graph represents the velocity of a particle as a function of time. The positive direction is right and the negative direction is left. 25 20 15 10 7 8 9 o -5 -10 -15 -20 25 time (s) 1. What is the instantaneous velocity of the particle at t-3.00s? 2. What is the instantaneous velocity of the particle at...
You don’t have to do every single problem. I would just like help to get me...
 You don’t have to do every single problem. I would just like
help to get me started. So if there’s two or theee of almost the
same question then you can just do one of these. For an example for
the position graph; you only have to do problems: 1 , 2, 4, 6.
Thank you so much!
くBack Graphs-xt.pdfaビ山 Graph Practice Problems-x vs. t PHYS&114 Name: Complete all these problems on a separate sheet of paper. The graph represents...
You don’t have to do every single problem. I would just like
help to get me started. So if there’s two or theee of almost the
same question then you can just do one of these. For an example for
the position graph; you only have to do problems: 1 , 2, 4, 6.
Thank you so much!
くBack Graphs-xt.pdfaビ山 Graph Practice Problems-x vs. t PHYS&114 Name: Complete all these problems on a separate sheet of paper. The graph represents...
i just need the second image "from the previous problem" explained 17 The position of a...
 i just need the second image "from the previous problem"
explained
17 The position of a particle moving along the x axis is given in centimeters by x -9.751.50r3, where tis in seconds. Calculate (a) the average velocity during the time interval-2.00s to-3.00 s; (b) the instantaneous velocity at 2.00 s; (c) the instantaneous ve- locity at t-3.00s; (d) the instantaneous velocity at -2.50s; and (e) the instantaneous velocity when the particle is midway between its positions at t =...
i just need the second image "from the previous problem"
explained
17 The position of a particle moving along the x axis is given in centimeters by x -9.751.50r3, where tis in seconds. Calculate (a) the average velocity during the time interval-2.00s to-3.00 s; (b) the instantaneous velocity at 2.00 s; (c) the instantaneous ve- locity at t-3.00s; (d) the instantaneous velocity at -2.50s; and (e) the instantaneous velocity when the particle is midway between its positions at t =...
#21 west3-G Mector Kinematics 17. (1) The position of a particular particle as a function of...
 #21
west3-G Mector Kinematics 17. (1) The position of a particular particle as a function of time 18. (7 What was the average velocity of the particle in Problem 17 19. (I1) What is the shape of the path of the particle of 20. (II) A car is moving with speed 18.0 m/s due south at one is given by (9.6011+ 8.85-1.0012 k) m. Determine the particle's velocity and acceleration as a function of time between t 1.00s and t...
#21
west3-G Mector Kinematics 17. (1) The position of a particular particle as a function of time 18. (7 What was the average velocity of the particle in Problem 17 19. (I1) What is the shape of the path of the particle of 20. (II) A car is moving with speed 18.0 m/s due south at one is given by (9.6011+ 8.85-1.0012 k) m. Determine the particle's velocity and acceleration as a function of time between t 1.00s and t...
 Can you do 4,5,7,8 please
Graph Practice Problems -v vs.t PHYS&114 Name: Use the graph below to answer questions 1-11. The graph represents the velocity of a particle as a function of time. The positive direction is right and the negative direction is left. 25 20 15 10 7 8 9 o -5 -10 -15 -20 25 time (s) 1. What is the instantaneous velocity of the particle at t-3.00s? 2. What is the instantaneous velocity of the particle at...
Can you do 4,5,7,8 please
Graph Practice Problems -v vs.t PHYS&114 Name: Use the graph below to answer questions 1-11. The graph represents the velocity of a particle as a function of time. The positive direction is right and the negative direction is left. 25 20 15 10 7 8 9 o -5 -10 -15 -20 25 time (s) 1. What is the instantaneous velocity of the particle at t-3.00s? 2. What is the instantaneous velocity of the particle at...
 You don’t have to do every single problem. I would just like
help to get me started. So if there’s two or theee of almost the
same question then you can just do one of these. For an example for
the position graph; you only have to do problems: 1 , 2, 4, 6.
Thank you so much!
くBack Graphs-xt.pdfaビ山 Graph Practice Problems-x vs. t PHYS&114 Name: Complete all these problems on a separate sheet of paper. The graph represents...
You don’t have to do every single problem. I would just like
help to get me started. So if there’s two or theee of almost the
same question then you can just do one of these. For an example for
the position graph; you only have to do problems: 1 , 2, 4, 6.
Thank you so much!
くBack Graphs-xt.pdfaビ山 Graph Practice Problems-x vs. t PHYS&114 Name: Complete all these problems on a separate sheet of paper. The graph represents...
 i just need the second image "from the previous problem"
explained
17 The position of a particle moving along the x axis is given in centimeters by x -9.751.50r3, where tis in seconds. Calculate (a) the average velocity during the time interval-2.00s to-3.00 s; (b) the instantaneous velocity at 2.00 s; (c) the instantaneous ve- locity at t-3.00s; (d) the instantaneous velocity at -2.50s; and (e) the instantaneous velocity when the particle is midway between its positions at t =...
i just need the second image "from the previous problem"
explained
17 The position of a particle moving along the x axis is given in centimeters by x -9.751.50r3, where tis in seconds. Calculate (a) the average velocity during the time interval-2.00s to-3.00 s; (b) the instantaneous velocity at 2.00 s; (c) the instantaneous ve- locity at t-3.00s; (d) the instantaneous velocity at -2.50s; and (e) the instantaneous velocity when the particle is midway between its positions at t =...
 #21
west3-G Mector Kinematics 17. (1) The position of a particular particle as a function of time 18. (7 What was the average velocity of the particle in Problem 17 19. (I1) What is the shape of the path of the particle of 20. (II) A car is moving with speed 18.0 m/s due south at one is given by (9.6011+ 8.85-1.0012 k) m. Determine the particle's velocity and acceleration as a function of time between t 1.00s and t...
#21
west3-G Mector Kinematics 17. (1) The position of a particular particle as a function of time 18. (7 What was the average velocity of the particle in Problem 17 19. (I1) What is the shape of the path of the particle of 20. (II) A car is moving with speed 18.0 m/s due south at one is given by (9.6011+ 8.85-1.0012 k) m. Determine the particle's velocity and acceleration as a function of time between t 1.00s and t...
Most questions answered within 3 hours.
-
. Suppose a discrete random variable has probability
distribution
P(x) = .2 if x = 0...
asked 25 seconds from now -
Why do organizations decline? What steps can top
management take to halt, decline, and restore organizational...
asked 13 minutes ago -
Under the influence of its drive force, a snowmobile is moving
at a constant velocity along...
asked 27 minutes ago -
What mechanisms Drive speciation??
(I.e. what was Dawins theory on the orgin of species, and how...
asked 1 hour ago -
The manager at a car assembly plant believes that the mean
assembly time for a car...
asked 2 hours ago -
Which of the following is true of electron capture?
A) It decreases the nuclide's mass number...
asked 4 hours ago -
Assuming an efficiency of 43.10%, calculate the actual yield of
magnesium nitrate formed from 114.9 g...
asked 4 hours ago -
The highly pathogenic bacterium Clostridium
perfringens causes gangrene, a disease that results in the
destruction of...
asked 6 hours ago -
In the context of situation analysis, which of the following is
a category for analysis in...
asked 6 hours ago -
In a study of the gas phase decomposition of sulfuryl chloride
at 600 K SO2Cl2(g)SO2(g) +...
asked 6 hours ago -
75 g of 2-propanol (C3H8O) and 25 g of pentane are mixed in a
200 mL...
asked 6 hours ago -
The 2800-turn coil in a dc motor has an area per turn of 1.1 ×
10-2...
asked 6 hours ago