
Homework Answers

If you have any doubt, kindly comment below. I will be happy to help you.
Add Answer to:
Please draw the bode diagram (both magnitude and phase) of the following transfer functions step by...
1. For the transfer functions below, draw the bode plot for amplitude and phase response. Please...
 1. For the transfer functions below, draw the bode plot for amplitude and phase response. Please show step by step. (s+20) (s+5)(s+500s+250000) 100(s+1) s2 +110s+1000 H(s)
Sketch the approximate Bode magnitude and phase plots for the following transfer functions by hand. a....
 Sketch the approximate Bode magnitude and phase plots for the following transfer functions by hand. a. G(s) b. G(s)- 200 (s2 +2s)(0.1s +1) s+1 s2 +2s +100
answer quickly please Problem 3. Draw the Bode plot of the transfer function G3(8) that you...
 answer quickly please
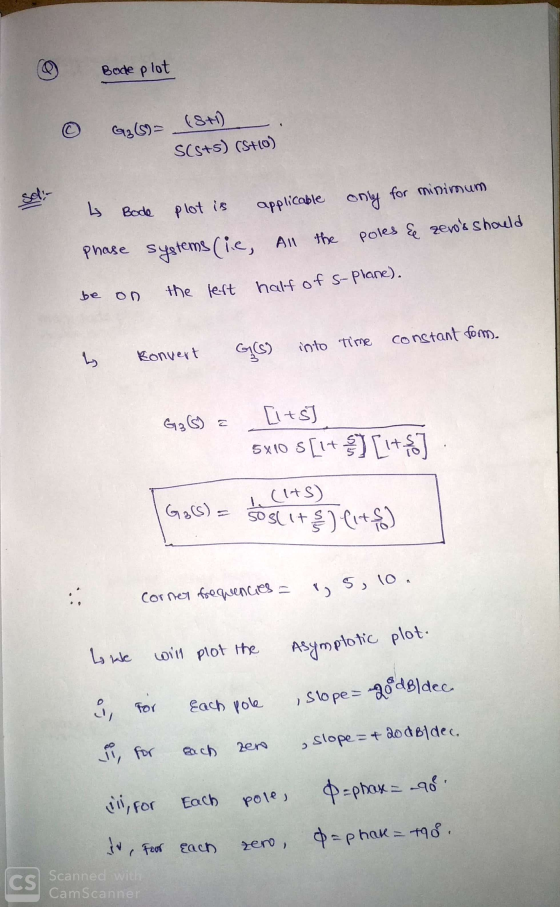
Problem 3. Draw the Bode plot of the transfer function G3(8) that you found in the system setup section. Follow the instructions we explained in the class. (a) Determine the basic factors and corner frequencies. (b) Determine the slope, magnitude, and phase at a very low frequency. (c) Determine the phase and slope at corner frequencies. (d) Determine the phase and slope at a very high frequency. (e) Draw the Bode plot. Provide the details of your...
answer quickly please
Problem 3. Draw the Bode plot of the transfer function G3(8) that you found in the system setup section. Follow the instructions we explained in the class. (a) Determine the basic factors and corner frequencies. (b) Determine the slope, magnitude, and phase at a very low frequency. (c) Determine the phase and slope at corner frequencies. (d) Determine the phase and slope at a very high frequency. (e) Draw the Bode plot. Provide the details of your...
Problem 5: For the following transfer functions, sketch the bode asymptotic magnitude and phase p...
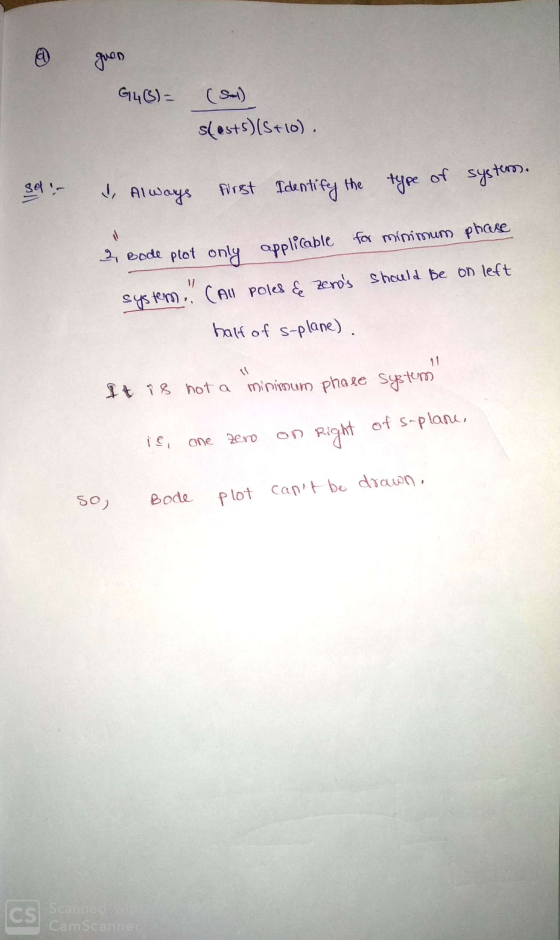
 Problem 5: For the following transfer functions, sketch the bode asymptotic magnitude and phase plots, find the Gain margin and Phase margin, find the system type and the corresponding error constant for each case. G(A) (s +3)(s +5) s(s +2) (s+4) S+5 2)b).
Problem 5: For the following transfer functions, sketch the bode asymptotic magnitude and phase plots, find the Gain margin and Phase margin, find the system type and the corresponding error constant for each case. G(A) (s +3)(s...
Problem 5: For the following transfer functions, sketch the bode asymptotic magnitude and phase plots, find the Gain margin and Phase margin, find the system type and the corresponding error constant for each case. G(A) (s +3)(s +5) s(s +2) (s+4) S+5 2)b).
Problem 5: For the following transfer functions, sketch the bode asymptotic magnitude and phase plots, find the Gain margin and Phase margin, find the system type and the corresponding error constant for each case. G(A) (s +3)(s...
For the following closed-loop transfer functions, sketch the bode plots (magnitude and phase), id...
 For the following closed-loop transfer functions, sketch the bode plots (magnitude and phase), iden- tifying the zero gain, the slopes (in Decibels) and the high-frequency cutt-off rate. Then verify with Matlab C()101 100) s 0.1) (s 10) 100 s(s +10)2 G(s) = (56) G(s) = s+10(s+100)
For the following closed-loop transfer functions, sketch the bode plots (magnitude and phase), iden- tifying the zero gain, the slopes (in Decibels) and the high-frequency cutt-off rate. Then verify with Matlab C()101 100) s...
For the following closed-loop transfer functions, sketch the bode plots (magnitude and phase), iden- tifying the zero gain, the slopes (in Decibels) and the high-frequency cutt-off rate. Then verify with Matlab C()101 100) s 0.1) (s 10) 100 s(s +10)2 G(s) = (56) G(s) = s+10(s+100)
For the following closed-loop transfer functions, sketch the bode plots (magnitude and phase), iden- tifying the zero gain, the slopes (in Decibels) and the high-frequency cutt-off rate. Then verify with Matlab C()101 100) s...
2) Hand sketch the asymptotes of the Bode plot magnitude and phase for the following open-loop...
 2) Hand sketch the asymptotes of the Bode plot magnitude and phase for the following open-loop transfer functions. G()=— -2 (3) (s + 1)(+2)(8+3)
For the following closed-loop transfer functions, sketch the bode plots (magnitude and phase), id...
 For the following closed-loop transfer functions, sketch the bode plots (magnitude and phase), iden- tifying the zero gain, the slopes (in Decibels) and the high-frequency cutt-off rate. Then verify with Matlab (6) wn = 1, 〈 0.0.1, and 0.707. (8) Assuming the system of Problem 6 above, and an input of r(t) = 30sin(1000 t), use your bode plot to obtain the steady-state response
For the following closed-loop transfer functions, sketch the bode plots (magnitude and phase), iden- tifying the...
For the following closed-loop transfer functions, sketch the bode plots (magnitude and phase), iden- tifying the zero gain, the slopes (in Decibels) and the high-frequency cutt-off rate. Then verify with Matlab (6) wn = 1, 〈 0.0.1, and 0.707. (8) Assuming the system of Problem 6 above, and an input of r(t) = 30sin(1000 t), use your bode plot to obtain the steady-state response
For the following closed-loop transfer functions, sketch the bode plots (magnitude and phase), iden- tifying the...
Please plot on semi-log scale for both magnitude and phase separately B. Sketch the Bode plots...
 Please plot on semi-log scale for both magnitude and phase
separately
B. Sketch the Bode plots for the magnitude and the phase for the transfer function: 10(S + 1) H(S) = S(S + 10)(8 + 100)
Please plot on semi-log scale for both magnitude and phase
separately
B. Sketch the Bode plots for the magnitude and the phase for the transfer function: 10(S + 1) H(S) = S(S + 10)(8 + 100)
i) Draw the Bode plots (hand sketch, magnitude and phase!) for the following transfer function. Plot...
 i) Draw the Bode plots (hand sketch, magnitude and phase!) for the following transfer function. Plot over the range 0.1 to 1000 rad/s HS 10,000 (s) = s* + 20s 10,000 ii) what are the Q and Bw for this circuit? iii) Design and draw a circuit (including values) that would yield this transfer function. It should use a 100mH inductor , , Qano
Draw the bode diagram for the following transfer function · Draw the Bode Diagram for the...
 Draw the bode diagram for the following transfer
function
· Draw the Bode Diagram for the following transfer function: H(s) = 100/(s + 30)
Draw the bode diagram for the following transfer
function
· Draw the Bode Diagram for the following transfer function: H(s) = 100/(s + 30)
 1. For the transfer functions below, draw the bode plot for amplitude and phase response. Please show step by step. (s+20) (s+5)(s+500s+250000) 100(s+1) s2 +110s+1000 H(s)
 Sketch the approximate Bode magnitude and phase plots for the following transfer functions by hand. a. G(s) b. G(s)- 200 (s2 +2s)(0.1s +1) s+1 s2 +2s +100
 answer quickly please
Problem 3. Draw the Bode plot of the transfer function G3(8) that you found in the system setup section. Follow the instructions we explained in the class. (a) Determine the basic factors and corner frequencies. (b) Determine the slope, magnitude, and phase at a very low frequency. (c) Determine the phase and slope at corner frequencies. (d) Determine the phase and slope at a very high frequency. (e) Draw the Bode plot. Provide the details of your...
answer quickly please
Problem 3. Draw the Bode plot of the transfer function G3(8) that you found in the system setup section. Follow the instructions we explained in the class. (a) Determine the basic factors and corner frequencies. (b) Determine the slope, magnitude, and phase at a very low frequency. (c) Determine the phase and slope at corner frequencies. (d) Determine the phase and slope at a very high frequency. (e) Draw the Bode plot. Provide the details of your...
 Problem 5: For the following transfer functions, sketch the bode asymptotic magnitude and phase plots, find the Gain margin and Phase margin, find the system type and the corresponding error constant for each case. G(A) (s +3)(s +5) s(s +2) (s+4) S+5 2)b).
Problem 5: For the following transfer functions, sketch the bode asymptotic magnitude and phase plots, find the Gain margin and Phase margin, find the system type and the corresponding error constant for each case. G(A) (s +3)(s...
Problem 5: For the following transfer functions, sketch the bode asymptotic magnitude and phase plots, find the Gain margin and Phase margin, find the system type and the corresponding error constant for each case. G(A) (s +3)(s +5) s(s +2) (s+4) S+5 2)b).
Problem 5: For the following transfer functions, sketch the bode asymptotic magnitude and phase plots, find the Gain margin and Phase margin, find the system type and the corresponding error constant for each case. G(A) (s +3)(s...
 For the following closed-loop transfer functions, sketch the bode plots (magnitude and phase), iden- tifying the zero gain, the slopes (in Decibels) and the high-frequency cutt-off rate. Then verify with Matlab C()101 100) s 0.1) (s 10) 100 s(s +10)2 G(s) = (56) G(s) = s+10(s+100)
For the following closed-loop transfer functions, sketch the bode plots (magnitude and phase), iden- tifying the zero gain, the slopes (in Decibels) and the high-frequency cutt-off rate. Then verify with Matlab C()101 100) s...
For the following closed-loop transfer functions, sketch the bode plots (magnitude and phase), iden- tifying the zero gain, the slopes (in Decibels) and the high-frequency cutt-off rate. Then verify with Matlab C()101 100) s 0.1) (s 10) 100 s(s +10)2 G(s) = (56) G(s) = s+10(s+100)
For the following closed-loop transfer functions, sketch the bode plots (magnitude and phase), iden- tifying the zero gain, the slopes (in Decibels) and the high-frequency cutt-off rate. Then verify with Matlab C()101 100) s...
 2) Hand sketch the asymptotes of the Bode plot magnitude and phase for the following open-loop transfer functions. G()=— -2 (3) (s + 1)(+2)(8+3)
 For the following closed-loop transfer functions, sketch the bode plots (magnitude and phase), iden- tifying the zero gain, the slopes (in Decibels) and the high-frequency cutt-off rate. Then verify with Matlab (6) wn = 1, 〈 0.0.1, and 0.707. (8) Assuming the system of Problem 6 above, and an input of r(t) = 30sin(1000 t), use your bode plot to obtain the steady-state response
For the following closed-loop transfer functions, sketch the bode plots (magnitude and phase), iden- tifying the...
For the following closed-loop transfer functions, sketch the bode plots (magnitude and phase), iden- tifying the zero gain, the slopes (in Decibels) and the high-frequency cutt-off rate. Then verify with Matlab (6) wn = 1, 〈 0.0.1, and 0.707. (8) Assuming the system of Problem 6 above, and an input of r(t) = 30sin(1000 t), use your bode plot to obtain the steady-state response
For the following closed-loop transfer functions, sketch the bode plots (magnitude and phase), iden- tifying the...
 Please plot on semi-log scale for both magnitude and phase
separately
B. Sketch the Bode plots for the magnitude and the phase for the transfer function: 10(S + 1) H(S) = S(S + 10)(8 + 100)
Please plot on semi-log scale for both magnitude and phase
separately
B. Sketch the Bode plots for the magnitude and the phase for the transfer function: 10(S + 1) H(S) = S(S + 10)(8 + 100)
 i) Draw the Bode plots (hand sketch, magnitude and phase!) for the following transfer function. Plot over the range 0.1 to 1000 rad/s HS 10,000 (s) = s* + 20s 10,000 ii) what are the Q and Bw for this circuit? iii) Design and draw a circuit (including values) that would yield this transfer function. It should use a 100mH inductor , , Qano
 Draw the bode diagram for the following transfer
function
· Draw the Bode Diagram for the following transfer function: H(s) = 100/(s + 30)
Draw the bode diagram for the following transfer
function
· Draw the Bode Diagram for the following transfer function: H(s) = 100/(s + 30)
Most questions answered within 3 hours.
-
a. Discuss the reciprocal/opposite “hormonal” regulation of the
most highly regulated steps of these two pathways....
asked 50 seconds ago -
Members of unions had mounted campaigns to persuade customers
not to shop at a company because...
asked 1 minute ago -
Why is the alpha carboxyl group pka value 2 ?
And why is an alpha amino...
asked 10 minutes ago -
Identify and assess an intrapreneurial
opportunities within Bank of America and
intrapreneurial assessment. Assess its impact...
asked 16 minutes ago -
How do I figure out the range of possible numbers that can be
represented by the...
asked 18 minutes ago -
A 0.48-kg metal sphere oscillates at the end of a vertical
spring. As the spring stretches...
asked 21 minutes ago -
If a block of Si is doped with 10^17 Boron atom/cm^3 and 5X10^16
Arsenic atoms/cm^3,
(a)...
asked 47 minutes ago -
Why would natural selection not minimize costs (in the form of
symptoms) of evolved defenses? (choose...
asked 1 hour ago -
What is true about a critical task?
Latest finish time - latest start time = 0...
asked 1 hour ago -
A company uses a
process costing system. Its Assembly Department's beginning
inventory consisted of 56,800 units,...
asked 1 hour ago -
a
sealed glass cylinder contains 325 g of N2 gas at 1.02 atm at 20 c....
asked 1 hour ago -
The main difference between an equity and a nonequity alliance
is that
A
equity alliances are...
asked 1 hour ago