A scientist study the relation of x=salinity level and y=nitrate level. He fitted a simple linear...
A scientist study the relation of x=salinity level and y=nitrate level. He fitted a simple linear
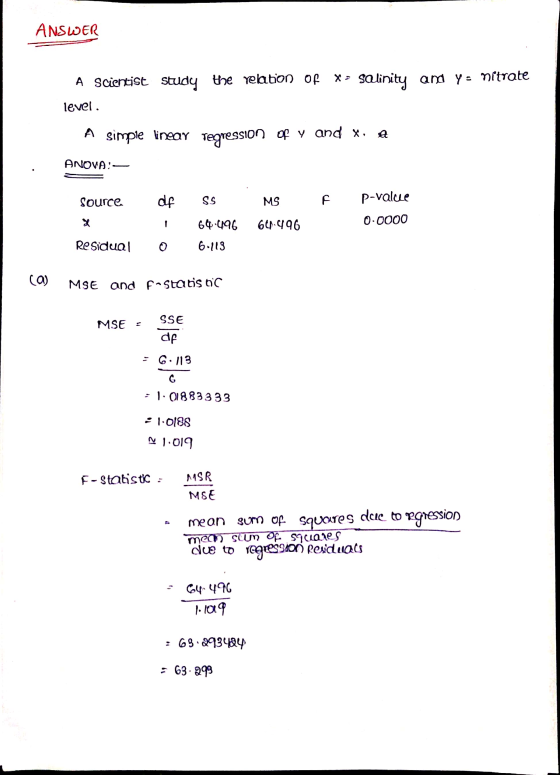
regression of y on x and got the following ANOVA table.
Analysis of Variance Table
Source df SS MS F p-value
X 1 64.496 64.496 0.0000
Residual 6 6.113
- MSE and F-statistic are missing in the table, please fill in.
- What is his sample size n?
- What is y’s total variation?
- what is the sample standard deviation sy?
- If we know x and y are negatively correlated, what is the sample correlation coefficient
between x and y?
- If we know the fitted regression line is y = 326.976 8.404x, what is x’s sample standard deviation sx?
Homework Answers
ANSWER::

NOTE:: I HOPE YOUR HAPPY WITH MY ANSWER....***PLEASE SUPPORT ME WITH YOUR RATING...
***PLEASE GIVE ME "LIKE"...ITS VERY IMPORTANT FOR ME NOW....PLEASE SUPPORT ME ....THANK YOU
Add Answer to:
A scientist study the relation of x=salinity level and y=nitrate
level. He fitted a simple linear...
A simple linear regression (linear regression with only one predictor) analysis was carried out using a...
 A simple linear regression (linear regression with only one predictor) analysis was carried out using a sample of 23 observations From the sample data, the following information was obtained: SST = [(y - 3)² = 220.12, SSE= L = [(yi - ġ) = 83.18, Answer the following: EEEEEEEE Complete the Analysis of VAriance (ANOVA) table below. df SS MS F Source Regression (Model) Residual Error Total Regression standard error (root MSE) = 8 = The % of variation in the...
Decide (with short explanations) whether the following statements are true or false. e) In a simple linear regression model with explanatory variable x and outcome variable y, we have these summary s...
 Decide (with short explanations) whether the following
statements are true or false.
e) In a simple linear regression model with explanatory variable x and outcome variable y, we have these summary statisties z-10, s/-3 sy-5 and у-20. For a new data point with x = 13, it is possible that the predicted value is y = 26. f A standard multiple regression model with continuous predictors and r2, a categorical predictor T with four values, an interaction between a and...
Decide (with short explanations) whether the following
statements are true or false.
e) In a simple linear regression model with explanatory variable x and outcome variable y, we have these summary statisties z-10, s/-3 sy-5 and у-20. For a new data point with x = 13, it is possible that the predicted value is y = 26. f A standard multiple regression model with continuous predictors and r2, a categorical predictor T with four values, an interaction between a and...
4.he sample correlation coefficient between X and Y, rxy Sx/Sx S where S-the covariance between X...
 4.he sample correlation coefficient between X and Y, rxy Sx/Sx S where S-the covariance between X and Ys Σ(X-XM) (-Yu)/ n-1 Sx the standard deviation of X and Sy the standard deviation of Y I) If the covariance is positive, the correlation coefficient must be positive: True or False? ii) If the covariance is negative, the correlation coefficient must be positive: True or False? a) ii) The correlation coefficient must lie between 0 and 1. True or False? v)lf the...
A manager at a local bank analyzed the relationship between monthly salary (y, in $) and length o...
A manager at a local bank analyzed the relationship between monthly salary (y, in $) and length of service (x, measured in months) for 30 employees. She estimates the model: Salary = β0 + β1 Service + ε. The following ANOVA table summarizes a portion of the regression results. df SS MS F Regression 1 555,420 555,420 7.64 Residual 27 1,962,873 72,699 Total 28 2,518,293 Coefficients Standard Error t-stat p-value Intercept 784.92 322.25 2.44 0.02 Service 9.19 3.20 2.87 0.01...
(Do this problem without using R) Consider the simple linear regression model y =β0 + β1x...
(Do this problem without using R) Consider the simple linear regression model y =β0 + β1x + ε, where the errors are independent and normally distributed, with mean zero and constant variance σ2. Suppose we observe 4 observations x = (1, 1, −1, −1) and y = (5, 3, 4, 0). (a) Fit the simple linear regression model to this data and report the fitted regression line. (b) Carry out a test of hypotheses using α = 0.05 to determine...
(13 points) Suppose you have a simple linear regression model such that Y; = Bo +...
 (13 points) Suppose you have a simple linear regression model such that Y; = Bo + B18: +€4 with and N(0,0%) Call: 1m (formula - y - x) Formula: F=MSR/MSE, R2 = SSR/SSTO ANOVA decomposition: SSTOSSE + SSR Residuals: Min 1Q Modian -2.16313 -0.64507 -0.06586 Max 30 0.62479 3.00517 Coefficients: Estimate Std. Error t value Pr(> It) (Intercept) 8.00967 0.36529 21.93 -0.62009 0.04245 -14.61 <2e-16 ... <2e-16 .. Signif. codes: ****' 0.001 '** 0.01 '* 0.05 0.1'' 1 Residual standard...
A sample with two variables (x and y) is given in the table. According to the...
A sample with two variables (x and y) is given in the table. According to the sample, please develop an excel spreadsheet to calculate the missing values given in the table of “summary output” attached below. The excel spreadsheet needs to be submitted together with your assignment. Note: You can use “data analysis toolpak” to check your answers, but calculations should be based on the formulas that we learnt in module 2. x y 1.0 5.2 1.5 7.2 2.0 5.5...
1. In simple linear regression analysis, we assume that the variance of the independent variable (X)...
1. In simple linear regression analysis, we assume that the variance of the independent variable (X) is equal to the variance of the dependent variable (Y) True False 2. The standard deviation of the sampling distribution of the sample mean is the same as the population standard deviation. True False 3. If n=20 and p=.4, then the mean of the binomial distribution is 8 True False 4. If a population is known to be normally distributed, then it follows that...
please help! Following is a simple linear regression model: y = a + A + &...
 please help!
Following is a simple linear regression model: y = a + A + & The following results were obtained from some statistical software. R2 = 0.523 Syx (regression standard error) = 3.028 n (total observations) = 41 Significance level = 0.05 = 5% Variable Interecpt Slope of X Parameter Estimate 0.519 -0.707 Std. Err. of Parameter Est 0.132 0.239 Note: For all the calculated numbers, keep three decimals. Write the fitted model (5 points) 2. Make a prediction...
please help!
Following is a simple linear regression model: y = a + A + & The following results were obtained from some statistical software. R2 = 0.523 Syx (regression standard error) = 3.028 n (total observations) = 41 Significance level = 0.05 = 5% Variable Interecpt Slope of X Parameter Estimate 0.519 -0.707 Std. Err. of Parameter Est 0.132 0.239 Note: For all the calculated numbers, keep three decimals. Write the fitted model (5 points) 2. Make a prediction...
A regression model relating x, number of salespersons at a branch office, to y, annual sales...
A regression model relating x, number of salespersons at a branch office, to y, annual sales at the office (in thousands of dollars) provided the following computer output from a regression analysis of the data. Where n total=26. a. Write the estimated regression equation (to whole number). y=_____+_____x b. Compute the F statistic and test the significance of the relationship at a .05 level of significance. (to 2 decimals) F-value ____ p-value is _______, we _________ h0 c. Compute the...
 A simple linear regression (linear regression with only one predictor) analysis was carried out using a sample of 23 observations From the sample data, the following information was obtained: SST = [(y - 3)² = 220.12, SSE= L = [(yi - ġ) = 83.18, Answer the following: EEEEEEEE Complete the Analysis of VAriance (ANOVA) table below. df SS MS F Source Regression (Model) Residual Error Total Regression standard error (root MSE) = 8 = The % of variation in the...
 Decide (with short explanations) whether the following
statements are true or false.
e) In a simple linear regression model with explanatory variable x and outcome variable y, we have these summary statisties z-10, s/-3 sy-5 and у-20. For a new data point with x = 13, it is possible that the predicted value is y = 26. f A standard multiple regression model with continuous predictors and r2, a categorical predictor T with four values, an interaction between a and...
Decide (with short explanations) whether the following
statements are true or false.
e) In a simple linear regression model with explanatory variable x and outcome variable y, we have these summary statisties z-10, s/-3 sy-5 and у-20. For a new data point with x = 13, it is possible that the predicted value is y = 26. f A standard multiple regression model with continuous predictors and r2, a categorical predictor T with four values, an interaction between a and...
 4.he sample correlation coefficient between X and Y, rxy Sx/Sx S where S-the covariance between X and Ys Σ(X-XM) (-Yu)/ n-1 Sx the standard deviation of X and Sy the standard deviation of Y I) If the covariance is positive, the correlation coefficient must be positive: True or False? ii) If the covariance is negative, the correlation coefficient must be positive: True or False? a) ii) The correlation coefficient must lie between 0 and 1. True or False? v)lf the...
 (13 points) Suppose you have a simple linear regression model such that Y; = Bo + B18: +€4 with and N(0,0%) Call: 1m (formula - y - x) Formula: F=MSR/MSE, R2 = SSR/SSTO ANOVA decomposition: SSTOSSE + SSR Residuals: Min 1Q Modian -2.16313 -0.64507 -0.06586 Max 30 0.62479 3.00517 Coefficients: Estimate Std. Error t value Pr(> It) (Intercept) 8.00967 0.36529 21.93 -0.62009 0.04245 -14.61 <2e-16 ... <2e-16 .. Signif. codes: ****' 0.001 '** 0.01 '* 0.05 0.1'' 1 Residual standard...
 please help!
Following is a simple linear regression model: y = a + A + & The following results were obtained from some statistical software. R2 = 0.523 Syx (regression standard error) = 3.028 n (total observations) = 41 Significance level = 0.05 = 5% Variable Interecpt Slope of X Parameter Estimate 0.519 -0.707 Std. Err. of Parameter Est 0.132 0.239 Note: For all the calculated numbers, keep three decimals. Write the fitted model (5 points) 2. Make a prediction...
please help!
Following is a simple linear regression model: y = a + A + & The following results were obtained from some statistical software. R2 = 0.523 Syx (regression standard error) = 3.028 n (total observations) = 41 Significance level = 0.05 = 5% Variable Interecpt Slope of X Parameter Estimate 0.519 -0.707 Std. Err. of Parameter Est 0.132 0.239 Note: For all the calculated numbers, keep three decimals. Write the fitted model (5 points) 2. Make a prediction...
Most questions answered within 3 hours.
-
Which of the following is true of electron capture?
A) It decreases the nuclide's mass number...
asked 1 hour ago -
Assuming an efficiency of 43.10%, calculate the actual yield of
magnesium nitrate formed from 114.9 g...
asked 2 hours ago -
The highly pathogenic bacterium Clostridium
perfringens causes gangrene, a disease that results in the
destruction of...
asked 3 hours ago -
In the context of situation analysis, which of the following is
a category for analysis in...
asked 3 hours ago -
In a study of the gas phase decomposition of sulfuryl chloride
at 600 K SO2Cl2(g)SO2(g) +...
asked 3 hours ago -
75 g of 2-propanol (C3H8O) and 25 g of pentane are mixed in a
200 mL...
asked 3 hours ago -
The 2800-turn coil in a dc motor has an area per turn of 1.1 ×
10-2...
asked 4 hours ago -
Draw a combinational logic circuit diagram with a symbol inside
the box for two I/P of...
asked 4 hours ago -
The cliché we use quite a lot in finance is: there is a need to
maximize...
asked 4 hours ago -
In class we discussed the addition of HCl to alpha pinene. Would
you expect one or...
asked 4 hours ago -
I'm trying to explain to my daughter to help her please help
me
I tagged the...
asked 4 hours ago -
You want to accumulate $28,000 in 10 years using annual
payments, the first one in a...
asked 4 hours ago