
Homework Answers
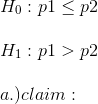
Proportion of drivers who wear seatbelt is greater in the south than in the Northeast.
b.)

Rejection Region: Any test statistic value greater than 1.55

e.)There is enough evidence to support the claim that Proportion of drivers who wear seatbelt is greater in the south than in the Northeast.
Add Answer to:
please help
of 480 drivers from the South, 402 weat a seatbelt in a survey 380...
In a survey of 490 drivers from the South, 412 wear a seat belt. In a...
 In a survey of 490 drivers from the South, 412 wear a seat belt. In a survey of 350 drivers from the Northeast, 291 wear a seat belt. At 0.07, can you support the claim that the proportion of drivers who wear seat belts is greater in the South than in the Northeast? Assume the random samples are independent. Complete parts (a) through (e) (a) Identify the claim and state Ho and H The claim is the proportion of drivers...
In a survey of 1000 drivers from Region A, 849 wear a seat belt. In a...
 In a survey of 1000 drivers from Region A, 849 wear a seat belt. In a survey of 1000 drivers from Region B, 906 wear a seat belt. At a = 0.01, is there evidence to support the claim that the proportion of drivers who wear seat belts in Region A is less than the proportion of drivers who wear seat belts in Region B? Assume that the samples are random and independent. Complete parts (a) through (e) below. (a)...
b.) find the critical values and rejection regions c.) find the standardized test statistic, z d.)...
 b.) find the critical values and rejection regions
c.) find the standardized test statistic, z
d.) decide whether to reject or fail to reject
e.) interpret
In a survey af 1000 drivers from Region A, 855 wear a seat belt. In a survey of 1000 drivers from Region B, 909 wear a seat bet. At a0.10, is there evidence to support the claim that the proportion of drivers who wear seat belts in Region A is less than the proportion...
b.) find the critical values and rejection regions
c.) find the standardized test statistic, z
d.) decide whether to reject or fail to reject
e.) interpret
In a survey af 1000 drivers from Region A, 855 wear a seat belt. In a survey of 1000 drivers from Region B, 909 wear a seat bet. At a0.10, is there evidence to support the claim that the proportion of drivers who wear seat belts in Region A is less than the proportion...
In a survey of 1000 drivers from Region A, 878 wear a seat belt. In a...
 In a survey of 1000 drivers from Region A, 878 wear a seat belt. In a survey of 1000 drivers from Region B. 923 wear a seat belt At a 001, is there evidence to support the dlaim that the proportion of drivers who wear seat belts in Region A is less than the proportion of drivers who wear seat belts in Region 8? Assume that the samples are random and independent Complete parts (a) through (e) below Identily the...
Question Hele ha survey of 1000 drivers from Region A 876 war a seat belt in...
 Question Hele ha survey of 1000 drivers from Region A 876 war a seat belt in a way of drivers from Region 3,923 war abelt 001, is there evidence to suport the came that the proportion des who wear seat belts in Region A is loss than the proportion of who were botsin Rajon? Asume that the samples are random and independent. Complete ports through below Ventily the daim Lal population 1 bedies from Region and let population be drivers...
In a survey of 180 females who recently completed high school, 75% were enrolled in college....
 In a survey of 180 females who recently completed high school, 75% were enrolled in college. In a survey of 160 males who recently completed high school, 65% were enrolled in college. At a = 0.06, can you reject the claim that there is no difference in the proportion of college enrollees between the two groups? Assume the random samples are independent. Complete parts (a) through (@). (a) Identify the claim and state Ho and H. The claim is "the...
An engineer wants to know if producing metal bars using a new experimental treatment rather than...
An engineer wants to know if producing metal bars using a new experimental treatment rather than the conventional treatment makes a difference in the tensile strength of the bars (the ability to resist tearing when pulled lengthwise). At α=0.20, answer parts (a) through (e). Assume the population variances are equal and the samples are random. If convenient, use technology to solve the problem. . Treatment Tensile strengths (newtons per square millimeter) Experimental 421 372 389 404 383 425 360 ...
In a survey of 180 females who recently completed high school, 75% were enrolled in college....
 In a survey of 180 females who recently completed high school, 75% were enrolled in college. In a survey of 160 males who recently completed high school, 65% were enrolled in college. Atc=0.06, can you reject the claim that there is no difference in the proportion of college enrollees between the two groups? Assume the random samples are independent. Complete parts (a) through (e) (a) Identify the claim and state Ho and H. The claim is the proportion of female...
A research center claims that at most 76% of adults in a certain country think that...
A research center claims that at most 76% of adults in a certain country think that drivers are safer using hands-free cell phones instead of using hand-held cell phones. In a random sample of 200 adults from that country 79% think that drivers are safer usinghands-free cell phones instead of using hand-held cell phones. At alphaαequals=0.01, is there enough evidence to reject the center's claim? Complete parts (a) through (e) below. What is the claim? Identify Upper H 0H0 and...
In a survey of 180 females who recently completed high school, 75% were enrolled in college....
 In a survey of 180 females who recently completed high school, 75% were enrolled in college. In a survey of 160 males who recently completed high school, 65% were enrolled in college. At a =0.06, can you reject the claim that there is no difference in the proportion of college enrollees between the two groups? Assume the random samples are independent. Complete parts (a) through (@). (a) Identify the claim and state Ho and Ha. The claim is "the proportion...
 In a survey of 490 drivers from the South, 412 wear a seat belt. In a survey of 350 drivers from the Northeast, 291 wear a seat belt. At 0.07, can you support the claim that the proportion of drivers who wear seat belts is greater in the South than in the Northeast? Assume the random samples are independent. Complete parts (a) through (e) (a) Identify the claim and state Ho and H The claim is the proportion of drivers...
 In a survey of 1000 drivers from Region A, 849 wear a seat belt. In a survey of 1000 drivers from Region B, 906 wear a seat belt. At a = 0.01, is there evidence to support the claim that the proportion of drivers who wear seat belts in Region A is less than the proportion of drivers who wear seat belts in Region B? Assume that the samples are random and independent. Complete parts (a) through (e) below. (a)...
 b.) find the critical values and rejection regions
c.) find the standardized test statistic, z
d.) decide whether to reject or fail to reject
e.) interpret
In a survey af 1000 drivers from Region A, 855 wear a seat belt. In a survey of 1000 drivers from Region B, 909 wear a seat bet. At a0.10, is there evidence to support the claim that the proportion of drivers who wear seat belts in Region A is less than the proportion...
b.) find the critical values and rejection regions
c.) find the standardized test statistic, z
d.) decide whether to reject or fail to reject
e.) interpret
In a survey af 1000 drivers from Region A, 855 wear a seat belt. In a survey of 1000 drivers from Region B, 909 wear a seat bet. At a0.10, is there evidence to support the claim that the proportion of drivers who wear seat belts in Region A is less than the proportion...
 In a survey of 1000 drivers from Region A, 878 wear a seat belt. In a survey of 1000 drivers from Region B. 923 wear a seat belt At a 001, is there evidence to support the dlaim that the proportion of drivers who wear seat belts in Region A is less than the proportion of drivers who wear seat belts in Region 8? Assume that the samples are random and independent Complete parts (a) through (e) below Identily the...
 Question Hele ha survey of 1000 drivers from Region A 876 war a seat belt in a way of drivers from Region 3,923 war abelt 001, is there evidence to suport the came that the proportion des who wear seat belts in Region A is loss than the proportion of who were botsin Rajon? Asume that the samples are random and independent. Complete ports through below Ventily the daim Lal population 1 bedies from Region and let population be drivers...
 In a survey of 180 females who recently completed high school, 75% were enrolled in college. In a survey of 160 males who recently completed high school, 65% were enrolled in college. At a = 0.06, can you reject the claim that there is no difference in the proportion of college enrollees between the two groups? Assume the random samples are independent. Complete parts (a) through (@). (a) Identify the claim and state Ho and H. The claim is "the...
 In a survey of 180 females who recently completed high school, 75% were enrolled in college. In a survey of 160 males who recently completed high school, 65% were enrolled in college. Atc=0.06, can you reject the claim that there is no difference in the proportion of college enrollees between the two groups? Assume the random samples are independent. Complete parts (a) through (e) (a) Identify the claim and state Ho and H. The claim is the proportion of female...
 In a survey of 180 females who recently completed high school, 75% were enrolled in college. In a survey of 160 males who recently completed high school, 65% were enrolled in college. At a =0.06, can you reject the claim that there is no difference in the proportion of college enrollees between the two groups? Assume the random samples are independent. Complete parts (a) through (@). (a) Identify the claim and state Ho and Ha. The claim is "the proportion...
Most questions answered within 3 hours.
-
In the following reaction, which element is undergoing
oxidation: Na2SO3 + N2O --> N2 + Na2SO4...
asked 32 minutes ago -
Which of the following pairs of ions have the same electron
configuration?
I: Br− and Se2−...
asked 3 hours ago -
The Foremost Composite Materials Company is planning a two-day
sales conference for October 19-20. The conference...
asked 3 hours ago -
3) Illustrate the observed pattern of relatedness of organisms
versus adaptations to specific conditions. This means...
asked 3 hours ago -
In winter a lake has a 0.35 m thick ice layer over 1.10 m of
water....
asked 4 hours ago -
Assuming the following has been encrypted with a Vigenere cipher
below, use the method(s) and assumptions...
asked 5 hours ago -
How would I use switch statements to write a program that will
take an input of...
asked 4 hours ago -
Imagine a reaction in which methane gas combusts at a constant
pressure of 1 atm and...
asked 5 hours ago -
Two parallel wires (each 12 m in length) are separated by a
distance of 0.065 m...
asked 5 hours ago -
Suppose there were three masses at the corner of uniform
equilateral triangle. The masses are m1...
asked 5 hours ago -
Situation: A building that is 618 m above the ground floor. How
many times would a...
asked 5 hours ago -
help me and discuss one successful and one
unsuccessful international company/busines in Indonesia.whyit
succeed and why...
asked 5 hours ago