The average student-loan debt is reported to be $25,235. A student believes that the student-loan debt...
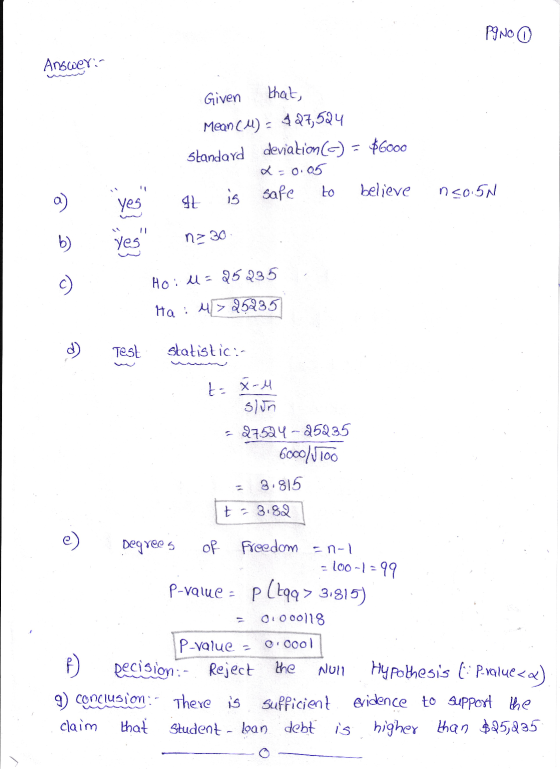
The average student-loan debt is reported to be $25,235. A student believes that the student-loan debt is higher in her area. She takes a random sample of 100 college students in her area and determines the mean student-loan debt is $27,524 and the standard deviation is $6,000. Is there sufficient evidence to support the student's claim at a 5% significance level?
Preliminary:
- Is it safe to assume that n≤5% of all college students in the
local area?
- Yes
- No
- Is n≥30?
- Yes
- No
Test the claim:
- Determine the null and alternative hypotheses. Enter
correct symbol and value.
H0: μ=
Ha: μ? < > ≠ - Determine the test statistic. Round to two
decimals.
t= - Find the pp-value. Round to 4 decimals.
p-value = - Make a decision.
- Reject the null hypothesis.
- Fail to reject the null hypothesis.
- Write the conclusion.
- There is sufficient evidence to support the claim that student-loan debt is higher than $25,235 in her area.
- There is not sufficient evidence to support the claim that student-loan debt is higher than $25,235 in her area.
Homework Answers
Add Answer to:
The average student-loan debt is reported to be $25,235. A
student believes that the student-loan debt...
The average student loan debt is reported to be $25,235. A student belives that the student loan debt is higher in...
 The average student loan debt is reported to be $25,235. A student belives that the student loan debt is higher in her area. She takes a random sample of 100 college students in her area and determines the mean to be $27,524 and the standard devition to be $6000. Is there sufficient evidence to support the student' claim at a 5% significance level? a) Determine the null and alternative hypotheses. Ho: d = Ho: Select an answer (Put in the...
The average student loan debt is reported to be $25,235. A student belives that the student...
 The average student loan debt is reported to be $25,235. A student belives that the student loan debt is higher in her area. She takes a random sample of 100 college students in her area and determines the mean to be $27,524 and the standard devition to be $6000. Is there sufficient evidence to support the student' claim at a 5% significance level? a) Determine the null and alternative hypotheses. H:H= H: Select an answer (Put in the correct symbol...
At least 0.49 of car crashes occur within 2 miles of the motorists home. a) Express...
 At least 0.49 of car crashes occur within 2 miles of the
motorists home.
a) Express the null and alternative hypotheses in symbolic form for
this claim.
Ho: p=
Ha:
Use the following codes to enter the following symbols:
≥≥ enter >=
≤≤ enter <=
≠≠ enter !=
b) You decide to survey 100 adult Americans and find that 10 of car
crashes occur within 2 miles of the motorists home. Find the test
statistic. Round to two decimal places....
At least 0.49 of car crashes occur within 2 miles of the
motorists home.
a) Express the null and alternative hypotheses in symbolic form for
this claim.
Ho: p=
Ha:
Use the following codes to enter the following symbols:
≥≥ enter >=
≤≤ enter <=
≠≠ enter !=
b) You decide to survey 100 adult Americans and find that 10 of car
crashes occur within 2 miles of the motorists home. Find the test
statistic. Round to two decimal places....
A student at a four-year college claims that mean enrollment at four-year colleges is higher than...
 A student at a four-year college claims that mean enrollment at four-year colleges is higher than at two-year colleges in the United States. Two surveys are conducted. Of the 35 four-year colleges surveyed, the mean enrollment was 5,466 with a standard deviation of 8,191. Of the 35 two-year colleges surveyed, the mean enrollment was 5,068 with a standard deviation of 4,777. Test the student's claim at the 0.10 significance level. a) The null and alternative hypothesis would be: O Hopp...
n 2011, a U.S. Census report determined that 71% of college students work. A researcher thinks...
n 2011, a U.S. Census report determined that 71% of college students work. A researcher thinks this percentage has changed since then. A survey of 110 college students reported that 91 of them work. Is there evidence to support the reasearcher's claim at the 1% significance level? A normal probability plot indicates that the population is normally distributed. a) Determine the null and alternative hypotheses. H0: p= Ha: p Select an answer not = ,< ,> (Put in the correct symbol...
Suppose a university advertises that its average class size is 34 or less. A student organization...
 Suppose a university advertises that its average class size is 34 or less. A student organization is concerned that budget cuts have led to increased class sizes and would like to test this claim. A random sample of 40 classes was selected, and the average class size was found to be 37.3 students. Assume that the standard deviation for class size at the college is 9 students. Using a 0.05, complete parts a and b below. a. Does the student...
An economist conducted a hypothesis test to test the claim that the average cost of eating...
An economist conducted a hypothesis test to test the claim that the average cost of eating a meal away from home decreased from 2009 to 2010. The average cost of eating a meal away from home in 2009 was $7.15 per person per meal. Assume that all conditions for testing have been met. He used technology to complete the hypothesis test and the p-value is 0.0315. Following is his null and alternative hypothesis and the output from his graphing calculator....
A data set includes data from student evaluations of courses. The summary statistics are nequals 91,...
A data set includes data from student evaluations of courses. The summary statistics are nequals 91, x overbar equals4.17, sequals 0.69. Use a 0.10 significance level to test the claim that the population of student course evaluations has a mean equal to 4.25 . Assume that a simple random sample has been selected. Identify the null and alternative hypotheses, test statistic, P-value, and state the final conclusion that addresses the original claim. What are the null and alternative hypotheses? A....
Need a little help. Please help You wish to test the claim that the average IQ...
Need a little help. Please help You wish to test the claim that the average IQ score is less than 100 at the .10 significance level. You determine the hypotheses are: Ho : μ = 100 H 1 : μ < 100 You take a simple random sample of 41 individuals and find the mean IQ score is 97.2, with a standard deviation of 14.9. Let's consider testing this hypothesis two ways: once with assuming the population standard deviation is...
Please Help! Need to confirm my answer. You wish to test the claim that the average...
Please Help! Need to confirm my answer. You wish to test the claim that the average IQ score is less than 100 at the .01 significance level. You determine the hypotheses are: Ho: μ = 100 H1: μ < 100 You take a simple random sample of 100 individuals and find the mean IQ score is 95.7, with a standard deviation of 16. Let's consider testing this hypothesis two ways: once with assuming the population standard deviation is not known...
 The average student loan debt is reported to be $25,235. A student belives that the student loan debt is higher in her area. She takes a random sample of 100 college students in her area and determines the mean to be $27,524 and the standard devition to be $6000. Is there sufficient evidence to support the student' claim at a 5% significance level? a) Determine the null and alternative hypotheses. Ho: d = Ho: Select an answer (Put in the...
 The average student loan debt is reported to be $25,235. A student belives that the student loan debt is higher in her area. She takes a random sample of 100 college students in her area and determines the mean to be $27,524 and the standard devition to be $6000. Is there sufficient evidence to support the student' claim at a 5% significance level? a) Determine the null and alternative hypotheses. H:H= H: Select an answer (Put in the correct symbol...
 At least 0.49 of car crashes occur within 2 miles of the
motorists home.
a) Express the null and alternative hypotheses in symbolic form for
this claim.
Ho: p=
Ha:
Use the following codes to enter the following symbols:
≥≥ enter >=
≤≤ enter <=
≠≠ enter !=
b) You decide to survey 100 adult Americans and find that 10 of car
crashes occur within 2 miles of the motorists home. Find the test
statistic. Round to two decimal places....
At least 0.49 of car crashes occur within 2 miles of the
motorists home.
a) Express the null and alternative hypotheses in symbolic form for
this claim.
Ho: p=
Ha:
Use the following codes to enter the following symbols:
≥≥ enter >=
≤≤ enter <=
≠≠ enter !=
b) You decide to survey 100 adult Americans and find that 10 of car
crashes occur within 2 miles of the motorists home. Find the test
statistic. Round to two decimal places....
 A student at a four-year college claims that mean enrollment at four-year colleges is higher than at two-year colleges in the United States. Two surveys are conducted. Of the 35 four-year colleges surveyed, the mean enrollment was 5,466 with a standard deviation of 8,191. Of the 35 two-year colleges surveyed, the mean enrollment was 5,068 with a standard deviation of 4,777. Test the student's claim at the 0.10 significance level. a) The null and alternative hypothesis would be: O Hopp...
 Suppose a university advertises that its average class size is 34 or less. A student organization is concerned that budget cuts have led to increased class sizes and would like to test this claim. A random sample of 40 classes was selected, and the average class size was found to be 37.3 students. Assume that the standard deviation for class size at the college is 9 students. Using a 0.05, complete parts a and b below. a. Does the student...
Most questions answered within 3 hours.
-
Why [M(CN)6] is not organometallic even it has metal
to carbon bond too
asked 43 seconds from now -
mstar electric has a bond issue outstanding that has a 20 year
life, a $1,000 par...
asked 6 minutes ago -
This is a Business Writing Question:
Common Types of Faulty Sentence Logic:
A. Mixed constructions
B....
asked 7 minutes ago -
Skinner asserts that science, and the common view of science, has
been tarnished. Explain his evidence...
asked 10 minutes ago -
Question 3 (1 point)
Fill in the blank. Speed Car Rental company found that the tire...
asked 10 minutes ago -
An short-seller in Tesla is worried the latest management
earnings forecast is too aggressive and the...
asked 10 minutes ago -
A grocery store's receipts show that Sunday customer purchases
have a skewed distribution with a mean...
asked 16 minutes ago -
A 0.035 mol sample of a weak acid, HA, is dissolved in 437 mL of
water...
asked 28 minutes ago -
a sample of Ar gas has a volume of 6.30 L with an unknown
pressure. the...
asked 28 minutes ago -
The
serum cholesterol levels of a population of kids follow a normal
distribution with mean 155...
asked 48 minutes ago -
han discusses the racist practice of badlands, a bar
in the Castro
district of San Francisco,...
asked 1 hour ago -
A sample of final exam scores is normally distributed with a
mean equal to 25 and...
asked 1 hour ago