please graph all 3 lines and explain the vmax&km

Homework Answers
| [s] | V1 | V2 | V3 | 1/[s] | 1/V1 | 1/V2 | 1/V3 |
| 1 | 12 | 4.3 | 5.5 | 1 | 0.083333 | 0.23255814 | 0.181818182 |
| 2 | 20 | 8 | 9 | 0.5 | 0.05 | 0.125 | 0.1111111111 |
| 4 | 29 | 14 | 13 | 0.25 | 0.0344827586 | 0.0714285714 | 0.0769230769 |
| 8 | 35 | 21 | 16 | 0.125 | 0.0285714286 | 0.0476190476 | 0.0625 |
| 12 | 40 | 26 | 18 | 0.083333 | 0.025 | 0.0384615385 | 0.0555555556 |

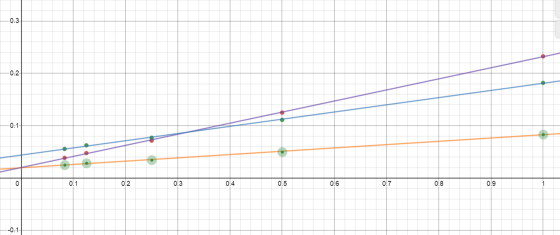

For Graph,
Orange - 1/V1
Purple -1/V2
Blue - 1/V3
Intercept = 1/Vmax. Then Vmax = 1/intercept.=1/b
For V1, Vmax = 1/0.0195259 = 51.214028 V
For V2, Vmax = 1/0.020042 = 49.89522 V
For V3, Vmax = 1/0.0438366 = 22.811988V
Slope = km/Vmax => km = Slope x Vmax=m x Vmax
For Without inhibitor, km = 0.0631953 x 51.214028 = 3.236485
For inhibitor A, km = 0.211842 x 49.89522 = 10.56990
For inhibitor B, km = 0.137221 x 22.811988 = 3.130283
V2 and V3 are competitive inhibitor. The reason is that the two curves intersect at a point and the slopes are different.
Add Answer to:
please graph all 3 lines and explain the
vmax&km
How to: Lineweaver Burke 1. The following...
5) (14 marks) The following kinetic data were obtained for an enzyme in the absence of...
 5) (14 marks) The following kinetic data were obtained for an enzyme in the absence of inhibitor (1), and in the presence of an inhibitor at 5 mM concentration (2). Assume[ET] is the same in each experiment. [S] (MM) (1) v(umol/mL sec) 12 (2) v(umol/mL sec) 4.3 1 8 2 4 20 29 14 21 8 35 12 40 26 a. Using a graphing program (excel or sigmaplot) construct a lineweaver burke plot representing the uninhibited reaction and the inhibited...
Prostaglandins are a class of eicosanoids (fatty acid derivatives) with a variety of extremely potent actions...
 Prostaglandins are a class of eicosanoids (fatty acid derivatives) with a variety of extremely potent actions on vertebrate tissues. They are responsible for producing fever and inflammation and its associated pain. Prostaglandins are derived from the 20-carbon fatty acid, arachidonic acid, in a reaction catalyzed by the enzyme, prostaglandin endoperoxide synthase. This uses oxygen to convert arachidonic acid to PGG2 (a prostaglandin). Ibuprofen inhibits this enzyme and is a fever reducer and anti-inflammatory agent. The kinetic data is given below...
Based on the graph of the "Determination of Km and Vmax" and "inhibition Studies" tube data,...
 Based on the graph of the "Determination of Km and Vmax"
and "inhibition Studies" tube data, what do you believe to be the
mode of inhibition by PTU? Why?
LINEWEAVER-BURKE PLOT FOR UNINHIBITED AND INHIBITED ENZYME United: 51. 81611.8755 ntion of and me Bed on the graph of the e w by Prut Why?
Based on the graph of the "Determination of Km and Vmax"
and "inhibition Studies" tube data, what do you believe to be the
mode of inhibition by PTU? Why?
LINEWEAVER-BURKE PLOT FOR UNINHIBITED AND INHIBITED ENZYME United: 51. 81611.8755 ntion of and me Bed on the graph of the e w by Prut Why?
Use the values from Table 13 to generate a Table showing 1/[S] and 1/V Plot Lineweaver...
 Use the values from Table 13 to generate a Table showing 1/[S]
and 1/V Plot Lineweaver Burke (1/v vs. 1/[s]) and caculate Km and
Vmax in the absence and presence of 1mM inhibitor A. What is the
nature of inhibitor A?
Plot 1/V vs 1/[S], and caculate the values of Km and Vmax in the
absence and presence of 3 mM and 5mM of inhibitor B. What is the
nature of inhibitor B?
Plot 1/V vs [I] i .e Dixon...
Use the values from Table 13 to generate a Table showing 1/[S]
and 1/V Plot Lineweaver Burke (1/v vs. 1/[s]) and caculate Km and
Vmax in the absence and presence of 1mM inhibitor A. What is the
nature of inhibitor A?
Plot 1/V vs 1/[S], and caculate the values of Km and Vmax in the
absence and presence of 3 mM and 5mM of inhibitor B. What is the
nature of inhibitor B?
Plot 1/V vs [I] i .e Dixon...
The following data was obtained for an enzyme in the absence of an inhibitor, and in...
The following data was obtained for an enzyme in the absence of an inhibitor, and in the presence of two different inhibitors. The concentration of each inhibitor was 10 mM. The total concentration of enzyme was the same for each experiment. [S] {mM} without inhibitor v, {umol/(ml*s)} with inhibitor A v, {umol/(ml*s)} With inhibitor B v, {umol/(ml*s)} 0.0 0.0 0.0 0.0 1.0 3.6 3.2 2.6 2.0 6.3 5.3 4.5 4.0 10.0 7.8 7.1 8.0 14.3 10.1 10.2 12.0 16.7 11.3...
8. A chemist obtains the following Lineweaver-Burk plots for an enzyme catalyzed reaction in the absence...
8. A chemist obtains the following Lineweaver-Burk plots for an enzyme catalyzed reaction in the absence and presence of two different inhibitors, A and B. The linear fit for no inhibition is: 1 ?0 = 302.6 1 [?] + 1.96 × 10⁵ The linear fit for inhibitor A is: 1 ?0 = 757.8 1 [?] + 2.03 × 10⁵ And the linear fit for inhibitor B is: 1 ?0 = 1015.3 1 [?] + 5.95 × 10⁵ a) Determine the...
The Lineweaver-Burke Plot for the enzyme in question 1 is shown below. In this plot, the...
The Lineweaver-Burke Plot for the enzyme in question 1 is shown below. In this plot, the y intercept (0.019153) is 1/vmax and the x intercept (-0.0449) is -1/km. What are the exact km and vmax based on this graph (show your work)? Km= Vmax=
3. Below is a Lineweaver-Burke plot of an enzyme reaction in the presence and absence of...
 3. Below is a Lineweaver-Burke plot of an enzyme reaction in the presence and absence of an inhibitor. 2.4 2.3 2.2 2.1 2 1.9 1.8 1.7 1.6 1.5 1.4 1.3 1.2 1.1 1 0.9 0.8 < 0.7 0.6 0.5 0.4 0.3 0.2 0.1 0 -0.1 -0.2 -0.3 -0.4 -0.5 -0.6 -0.7 -0.8 . . . . . -1 -0.9 -0.8 -0.7 -0.6 -0.5 -0.4 -0.3 -0.2 -0.1 O 0.1 0.2 0.3 0.4 0.5 0.6 0.7 0.8 0.9 1 1.1 1/[S]...
The following observations come from Lineweaver-Burke plots, based on kinetic data generated from a Michaelis/Menton-type enzyme...
The following observations come from Lineweaver-Burke plots, based on kinetic data generated from a Michaelis/Menton-type enzyme (E) that catalyzes the hydrolysis of a peptide substrate (S). All data were generated in the presence of 18.0 μM total enzyme. The enzyme-catalyzed reaction has a Km of 3.00 μM and a Vmax of 2.00 μM/sec. The enzyme-catalyzed reaction in the presence of 15.0 μM of Inhibitor A has an apparent Km of 2.25 μM and an apparent Vmax of 1.50 μM/sec. The...
8. A chemist obtains the following Lineweaver-Burk plots for an enzyme catalyzed reaction in the ...
 Pysical Chemistry! Please show all work thank you.
8. A chemist obtains the following Lineweaver-Burk plots for an enzyme catalyzed reaction in the absence and presence of two different inhibitors, A and B. The linear fit for no inhibition is 302.61.96 x 105 .0 x 10 2.5 x 10 2.0 x 10 1.5x 10 1.0 x10 The linear fit for inhibitor A is: 757.82.03 x 105 No inhibitor And the linear fit for inhibitor B is 50 к 10°- 1015.35.95...
Pysical Chemistry! Please show all work thank you.
8. A chemist obtains the following Lineweaver-Burk plots for an enzyme catalyzed reaction in the absence and presence of two different inhibitors, A and B. The linear fit for no inhibition is 302.61.96 x 105 .0 x 10 2.5 x 10 2.0 x 10 1.5x 10 1.0 x10 The linear fit for inhibitor A is: 757.82.03 x 105 No inhibitor And the linear fit for inhibitor B is 50 к 10°- 1015.35.95...
 5) (14 marks) The following kinetic data were obtained for an enzyme in the absence of inhibitor (1), and in the presence of an inhibitor at 5 mM concentration (2). Assume[ET] is the same in each experiment. [S] (MM) (1) v(umol/mL sec) 12 (2) v(umol/mL sec) 4.3 1 8 2 4 20 29 14 21 8 35 12 40 26 a. Using a graphing program (excel or sigmaplot) construct a lineweaver burke plot representing the uninhibited reaction and the inhibited...
 Prostaglandins are a class of eicosanoids (fatty acid derivatives) with a variety of extremely potent actions on vertebrate tissues. They are responsible for producing fever and inflammation and its associated pain. Prostaglandins are derived from the 20-carbon fatty acid, arachidonic acid, in a reaction catalyzed by the enzyme, prostaglandin endoperoxide synthase. This uses oxygen to convert arachidonic acid to PGG2 (a prostaglandin). Ibuprofen inhibits this enzyme and is a fever reducer and anti-inflammatory agent. The kinetic data is given below...
 Based on the graph of the "Determination of Km and Vmax"
and "inhibition Studies" tube data, what do you believe to be the
mode of inhibition by PTU? Why?
LINEWEAVER-BURKE PLOT FOR UNINHIBITED AND INHIBITED ENZYME United: 51. 81611.8755 ntion of and me Bed on the graph of the e w by Prut Why?
Based on the graph of the "Determination of Km and Vmax"
and "inhibition Studies" tube data, what do you believe to be the
mode of inhibition by PTU? Why?
LINEWEAVER-BURKE PLOT FOR UNINHIBITED AND INHIBITED ENZYME United: 51. 81611.8755 ntion of and me Bed on the graph of the e w by Prut Why?
 Use the values from Table 13 to generate a Table showing 1/[S]
and 1/V Plot Lineweaver Burke (1/v vs. 1/[s]) and caculate Km and
Vmax in the absence and presence of 1mM inhibitor A. What is the
nature of inhibitor A?
Plot 1/V vs 1/[S], and caculate the values of Km and Vmax in the
absence and presence of 3 mM and 5mM of inhibitor B. What is the
nature of inhibitor B?
Plot 1/V vs [I] i .e Dixon...
Use the values from Table 13 to generate a Table showing 1/[S]
and 1/V Plot Lineweaver Burke (1/v vs. 1/[s]) and caculate Km and
Vmax in the absence and presence of 1mM inhibitor A. What is the
nature of inhibitor A?
Plot 1/V vs 1/[S], and caculate the values of Km and Vmax in the
absence and presence of 3 mM and 5mM of inhibitor B. What is the
nature of inhibitor B?
Plot 1/V vs [I] i .e Dixon...
 3. Below is a Lineweaver-Burke plot of an enzyme reaction in the presence and absence of an inhibitor. 2.4 2.3 2.2 2.1 2 1.9 1.8 1.7 1.6 1.5 1.4 1.3 1.2 1.1 1 0.9 0.8 < 0.7 0.6 0.5 0.4 0.3 0.2 0.1 0 -0.1 -0.2 -0.3 -0.4 -0.5 -0.6 -0.7 -0.8 . . . . . -1 -0.9 -0.8 -0.7 -0.6 -0.5 -0.4 -0.3 -0.2 -0.1 O 0.1 0.2 0.3 0.4 0.5 0.6 0.7 0.8 0.9 1 1.1 1/[S]...
 Pysical Chemistry! Please show all work thank you.
8. A chemist obtains the following Lineweaver-Burk plots for an enzyme catalyzed reaction in the absence and presence of two different inhibitors, A and B. The linear fit for no inhibition is 302.61.96 x 105 .0 x 10 2.5 x 10 2.0 x 10 1.5x 10 1.0 x10 The linear fit for inhibitor A is: 757.82.03 x 105 No inhibitor And the linear fit for inhibitor B is 50 к 10°- 1015.35.95...
Pysical Chemistry! Please show all work thank you.
8. A chemist obtains the following Lineweaver-Burk plots for an enzyme catalyzed reaction in the absence and presence of two different inhibitors, A and B. The linear fit for no inhibition is 302.61.96 x 105 .0 x 10 2.5 x 10 2.0 x 10 1.5x 10 1.0 x10 The linear fit for inhibitor A is: 757.82.03 x 105 No inhibitor And the linear fit for inhibitor B is 50 к 10°- 1015.35.95...
Most questions answered within 3 hours.
-
New Air Heating and Cooling, manufactures furnaces and central
air units. The company pride itself on...
asked 7 minutes ago -
A coach uses a new technique to train gymnasts. Seven
gymnasts were randomly selected and their...
asked 2 hours ago -
While rotating the tires on your car you notice a rock [mass =
0.1 Kg] stuck...
asked 4 hours ago -
Using MARS simulator, write MIPS programs according to
the following scenarios: Receive a positive integer number...
asked 5 hours ago -
An object in front of a concave mirror has a real image that is
11.5 cm...
asked 6 hours ago -
Consider the reaction, C3 H8 + O2 --> CO2 + H2O. How many
moles of O2...
asked 7 hours ago -
You and your opponent both roll a fair die. If you both roll the
same number,...
asked 8 hours ago -
In a study of the accuracy of fast food drive-through orders,
Restaurant A had 257 accurate...
asked 8 hours ago -
Identify and describe in detail the four categories of
institutions that could be included in a...
asked 8 hours ago -
In python
class Customer:
def __init__(self, customer_id, last_name, first_name, phone_number, address):
self._customer_id = int(customer_id)
self._last_name =...
asked 8 hours ago -
What is an example of a limitation in implementing a new
ERP system and how it...
asked 8 hours ago -
In a section of 9.7cm of an artery with a radius of 2.6mm there
is a...
asked 8 hours ago