
Homework Answers


Add Answer to:
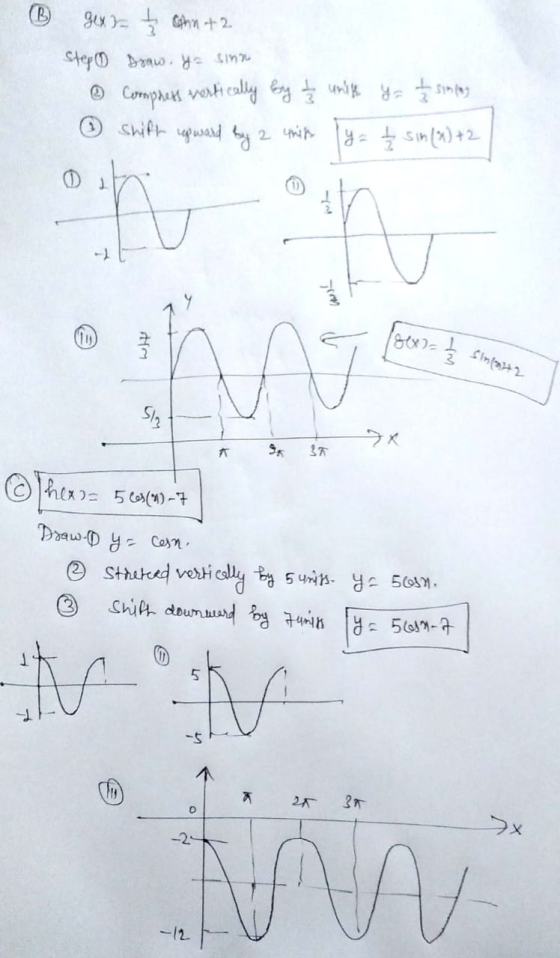
Sketch a graph of the following functions; assume that x is in degrees and be sure...
1) Sketch the graph of each of the following exponential functions. Make sure you label at...
 1) Sketch the graph of each of the following exponential functions. Make sure you label at least three points on the graph or include a t-chart with the coordinates. a. S(x)=3 b. y=213 c. g(x)= (3) 3 d. y e. f(x) = "+1
For each signal x(n) in Problems #(1)-(5), use Z Transform Tables to do the following: (a) Write ...
 For each signal x(n) in Problems #(1)-(5), use Z Transform Tables to do the following: (a) Write the formulas for its Z Transform, X(e), and Region of Convergence, RoCr (b) List the values of all poles and all zeros. (c) Sketch the pole zero diagram. Label both axes. Give key values along both axes. sin ( (-n))u-n]. (Hints: cos(π/3) (5) x1n] , 1/2, sin(π/3)-V3/2) ,"
For each signal x(n) in Problems #(1)-(5), use Z Transform Tables to do the following:...
For each signal x(n) in Problems #(1)-(5), use Z Transform Tables to do the following: (a) Write the formulas for its Z Transform, X(e), and Region of Convergence, RoCr (b) List the values of all poles and all zeros. (c) Sketch the pole zero diagram. Label both axes. Give key values along both axes. sin ( (-n))u-n]. (Hints: cos(π/3) (5) x1n] , 1/2, sin(π/3)-V3/2) ,"
For each signal x(n) in Problems #(1)-(5), use Z Transform Tables to do the following:...
3) Sketch the graph of the following rational functions. 2 a. f(x) = + +5r+6 x...
 3) Sketch the graph of the following rational functions. 2 a. f(x) = + +5r+6 x + 1 b. f(x) - 4x - 32 4) Solve each inequality. Give each solution in interval notation. a. + +8r+15 so b. 2x-5x > 3 C. (x - 1)(x+3)(x+5) > 0 x+3 d. > 0 x² - 5x+6 X +3 <2 2x+4 e.
Objective: • Graph and describe sinusoidal functions 1. Let x € R and let O be...
 Objective: • Graph and describe sinusoidal functions 1. Let x € R and let O be the radian measure of an angle in standard position. (a) Choose a value for z. Then let 0 = x and graph 0. (b) For any value of x, is it possible to find 0 = x? Explain. (c) Choose a value for 0 and graph 0. Is there a real number x that is equivalent to 0? Explain. (d) For any value of...
Q3 1. For the following, in (a) sketch the graphs of the functions and in (a)...
 Q3
1. For the following, in (a) sketch the graphs of the functions and in (a) and (b) find the areas as indicated (a) the area bounded by y = f(x) = x2 - 4x + 5 and y = g(2) = 2x - 3. (b) the area of the region that is common to r= 3 cos(0) and r = sin(). See sketch below. 2. Consider the region bounded by y? = 4, y = 2 and r =...
Q3
1. For the following, in (a) sketch the graphs of the functions and in (a) and (b) find the areas as indicated (a) the area bounded by y = f(x) = x2 - 4x + 5 and y = g(2) = 2x - 3. (b) the area of the region that is common to r= 3 cos(0) and r = sin(). See sketch below. 2. Consider the region bounded by y? = 4, y = 2 and r =...
Sketch two periods of a cosine wave, y(x,t) travelling in the x-direction Make sure that your...
Sketch two periods of a cosine wave, y(x,t) travelling in the x-direction Make sure that your axes are labelled. Let y(x=0,t) = +A.Annotate the sketch with: the amplitudes, +A and –A; the wavelength λ; the direction of travel (labeled with velocity, ‘v’); ‘crest’; ‘trough’. Point with arrows and label the points along the graph that are: i) in phase with y(x=0,t) and, ii) 180 degrees out of phase with y(x=0,t)
2. Sketch the graph of each of the following functions, and determine whether the given function...
 2. Sketch the graph of each of the following functions, and determine whether the given function is one-to-one. Show your work! (a) f(x) = -|x +31 – 2 (b) g(x) X + 3 X + 2
TEX Sketch the graph, and include at least two periods for the function without a calculator:...
 TEX Sketch the graph, and include at least two periods for the function without a calculator: f(x) = 4 cos + ) | – 2. Also, indicate the amplitude, period, vertical shift and phase shift for f(x). (8 points) 2 a. Amplitude = b. Period = c. Vertical Shift = d. Phase Shift = e. Sketch graph of y, label at least two distinct points (x, y) on the graph: 61 4 N 2 4 6 8 10 -10 -8...
1. Find the amplitude, period, midline, phase shift and graph over one period the following function:...
1. Find the amplitude, period, midline, phase shift and graph over one period the following function: f(x) = 5cos(2x − π). (Please don’t use a calculator, include details on the graph (points on both axes)) 2. Use the fundamental identities to fully simplify the expression: csc(x) + cos(x)cot(−x)
Please show all work. Thank you! 2. Sections 4.3,4.5,4.6 Graphing:Consider the function f (x) = sin(2x)...
 Please show all work. Thank
you!
2. Sections 4.3,4.5,4.6 Graphing:Consider the function f (x) = sin(2x) + cos(2x)on the interval [0, 1]. For this question, give your answers to parts a,b,c in interval notation. a. Find the intervals on which f is increasing or decreasing b. Find the local maximum and local minimum values of f c. Find the intervals of concavity d. Give the inflection points (if any) e. Sketch the graph of f. Be sure to label and...
Please show all work. Thank
you!
2. Sections 4.3,4.5,4.6 Graphing:Consider the function f (x) = sin(2x) + cos(2x)on the interval [0, 1]. For this question, give your answers to parts a,b,c in interval notation. a. Find the intervals on which f is increasing or decreasing b. Find the local maximum and local minimum values of f c. Find the intervals of concavity d. Give the inflection points (if any) e. Sketch the graph of f. Be sure to label and...
 1) Sketch the graph of each of the following exponential functions. Make sure you label at least three points on the graph or include a t-chart with the coordinates. a. S(x)=3 b. y=213 c. g(x)= (3) 3 d. y e. f(x) = "+1
 For each signal x(n) in Problems #(1)-(5), use Z Transform Tables to do the following: (a) Write the formulas for its Z Transform, X(e), and Region of Convergence, RoCr (b) List the values of all poles and all zeros. (c) Sketch the pole zero diagram. Label both axes. Give key values along both axes. sin ( (-n))u-n]. (Hints: cos(π/3) (5) x1n] , 1/2, sin(π/3)-V3/2) ,"
For each signal x(n) in Problems #(1)-(5), use Z Transform Tables to do the following:...
For each signal x(n) in Problems #(1)-(5), use Z Transform Tables to do the following: (a) Write the formulas for its Z Transform, X(e), and Region of Convergence, RoCr (b) List the values of all poles and all zeros. (c) Sketch the pole zero diagram. Label both axes. Give key values along both axes. sin ( (-n))u-n]. (Hints: cos(π/3) (5) x1n] , 1/2, sin(π/3)-V3/2) ,"
For each signal x(n) in Problems #(1)-(5), use Z Transform Tables to do the following:...
 3) Sketch the graph of the following rational functions. 2 a. f(x) = + +5r+6 x + 1 b. f(x) - 4x - 32 4) Solve each inequality. Give each solution in interval notation. a. + +8r+15 so b. 2x-5x > 3 C. (x - 1)(x+3)(x+5) > 0 x+3 d. > 0 x² - 5x+6 X +3 <2 2x+4 e.
 Objective: • Graph and describe sinusoidal functions 1. Let x € R and let O be the radian measure of an angle in standard position. (a) Choose a value for z. Then let 0 = x and graph 0. (b) For any value of x, is it possible to find 0 = x? Explain. (c) Choose a value for 0 and graph 0. Is there a real number x that is equivalent to 0? Explain. (d) For any value of...
 Q3
1. For the following, in (a) sketch the graphs of the functions and in (a) and (b) find the areas as indicated (a) the area bounded by y = f(x) = x2 - 4x + 5 and y = g(2) = 2x - 3. (b) the area of the region that is common to r= 3 cos(0) and r = sin(). See sketch below. 2. Consider the region bounded by y? = 4, y = 2 and r =...
Q3
1. For the following, in (a) sketch the graphs of the functions and in (a) and (b) find the areas as indicated (a) the area bounded by y = f(x) = x2 - 4x + 5 and y = g(2) = 2x - 3. (b) the area of the region that is common to r= 3 cos(0) and r = sin(). See sketch below. 2. Consider the region bounded by y? = 4, y = 2 and r =...
 2. Sketch the graph of each of the following functions, and determine whether the given function is one-to-one. Show your work! (a) f(x) = -|x +31 – 2 (b) g(x) X + 3 X + 2
 TEX Sketch the graph, and include at least two periods for the function without a calculator: f(x) = 4 cos + ) | – 2. Also, indicate the amplitude, period, vertical shift and phase shift for f(x). (8 points) 2 a. Amplitude = b. Period = c. Vertical Shift = d. Phase Shift = e. Sketch graph of y, label at least two distinct points (x, y) on the graph: 61 4 N 2 4 6 8 10 -10 -8...
 Please show all work. Thank
you!
2. Sections 4.3,4.5,4.6 Graphing:Consider the function f (x) = sin(2x) + cos(2x)on the interval [0, 1]. For this question, give your answers to parts a,b,c in interval notation. a. Find the intervals on which f is increasing or decreasing b. Find the local maximum and local minimum values of f c. Find the intervals of concavity d. Give the inflection points (if any) e. Sketch the graph of f. Be sure to label and...
Please show all work. Thank
you!
2. Sections 4.3,4.5,4.6 Graphing:Consider the function f (x) = sin(2x) + cos(2x)on the interval [0, 1]. For this question, give your answers to parts a,b,c in interval notation. a. Find the intervals on which f is increasing or decreasing b. Find the local maximum and local minimum values of f c. Find the intervals of concavity d. Give the inflection points (if any) e. Sketch the graph of f. Be sure to label and...
Most questions answered within 3 hours.
-
The number of major faults on a randomly chosen 1 km stretch of
highway has a...
asked 24 minutes ago -
Consider the competitive environment of Starbuck's, Progressive
Insurance, a manufacturing firm with low turnover, or a...
asked 1 hour ago -
3. Gains from trade
Consider two neighbouring island countries called Euphoria and
Contente. They each have...
asked 3 hours ago -
A business executive has the option to invest money in two
plans: Plan A guarantees that...
asked 5 hours ago -
Hello, can someone please help me answer this question?
How much heat is absorbed by a...
asked 5 hours ago -
. A marketing researcher conducted a survey of 25 shoppers
randomly selected at the local mall...
asked 5 hours ago -
Create an comprehensive response to the
following:
Antimicrobial agents work on a multitude of microbes (bacteria,...
asked 5 hours ago -
6.13 LAB: Step counter. Section 6.3.
A pedometer treats walking 2,000 steps as walking 1 mile....
asked 5 hours ago -
(14.2) A block of mass m = 10 kg riding on a frictionless
horizontal plane is...
asked 5 hours ago -
Use any search engine to search for articles about Starbucks
partnership with Tata Companies in India...
asked 5 hours ago -
Let’s say that for some reason Bank Excess Reserves suddenly
increase sharply. What effect would this...
asked 5 hours ago -
Given:
Curent Assets: $600,000
Total Assets: $2,600,000
Current Liabilities: $500,000
Total Liabilities: $1,700,000
What is the...
asked 5 hours ago