
Homework Answers


Add Answer to:
1) Sketch the graph of each of the following exponential functions. Make sure you label at...
3. Graph each of the exponential functions below. Make a table of values for each one...
 3. Graph each of the exponential functions below. Make a table of values for each one that contains a minimum of 5 points. a. S(x)=4 b. f(x)=e" +1 c. f(x) = 2x+1 d. f(x) = log3x
Use the graph of y=e* and transformations to sketch the exponential function f(x) = new Determine...
 Use the graph of y=e* and transformations to sketch the exponential function f(x) = new Determine the domain and range. Also, determine the y-intercept, and find the equation of the horizontal asymptote. Use the coordinates of the three points of the graph of y=e* to determine the corresponding points that lie on the graph of f(x) = -ex+6 Points that lie on the graph of y=e Points that lie on the graph of y=e* (-2,5) (0,1) (1,) Corresponding points that...
Sketch a graph of the following functions; assume that x is in degrees and be sure...
 Sketch a graph of the following functions; assume that x is in degrees and be sure to label your axes. Additionally, give their midline and amplitude. (A.) f(x) = 3 cos(x) — 3 (B.) g(x) = sin(x) + 2 (c.) h(x) = 5 cos(x) – 7 (n.) p(x) = sin(x) + 3
Given ?(?) = ? ? + ?? − ?, determine each of the following: a. The...
Given ?(?) = ? ? + ?? − ?, determine each of the following: a. The direction in which the graph opens b. The vertex; determine if it is a maximum or a minimum c. The axis of symmetry d. The y-intercept e. The coordinates of any x- intercepts, if they exist f. The domain and range g. Sketch the graph of each, make sure to label important points.
2. Use the information in the charts to answer the following questions and sketch the graph...
 2. Use the information in the charts to answer the following questions and sketch the graph of the function f(x) a) List all the critical points (both coordinates) and classify them as max, min, or neither b) List all the inflection points - ND + + ND - 0 + S. Sketch the graph of each given function by doing the following (box your answer to each of the questions) 1. Determine the domain of the function. Use limits to...
5. Letf(x) = x3 + x2 - x - 1. a. 6 pts Find all critical...
 5. Letf(x) = x3 + x2 - x - 1. a. 6 pts Find all critical values off. Show all work. Answers from a graph will not receive full credit. b. 6 pts Make a sign chart for f'(x). c. 4 pts List the x and y coordinates of all local maxima and minima on the graph off. Clearly identify if the point is a maximum or minimum. d. 6 pts Make a sign chart for f'(x). e. 4 pts...
Show all of your work. Label the axes and scale on your graph. The sketch should...
 Show all of your work. Label the axes and scale on your graph. The sketch should include at least three . to five points including the points of intersection and at least one point in between The integration techniques used should be clear and easy to follow step by step with all techniques shown in detail, including the substitution method. . . All steps must be shown in your own writing to receive any credit. Circle or box your final...
11. Find the CTFT for the following functions. Sketch and label the magnitude response of each...
 11. Find the CTFT for the following functions. Sketch and label the magnitude response of each transform. (a) f(t) = една(--t + 1) (b) f(t) = e-31 [u(t + 2) _ u(1-3)| (c), f(t) = e-3n sin (2t).
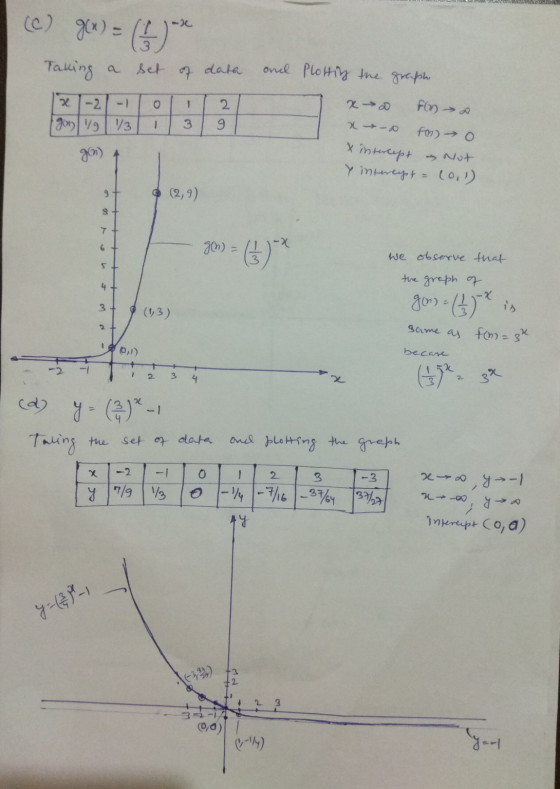
Sketch the graph of the exponential function. f(x) = 3X Complete the table of coordinates. x...
 Sketch the graph of the exponential function. f(x) = 3X Complete the table of coordinates. x -2 -1 0 1 | 2 | y 0.111 0.333 1 3 9 (Simplify your answers. Type integers or fractions.)
TEX Sketch the graph, and include at least two periods for the function without a calculator:...
 TEX Sketch the graph, and include at least two periods for the function without a calculator: f(x) = 4 cos + ) | – 2. Also, indicate the amplitude, period, vertical shift and phase shift for f(x). (8 points) 2 a. Amplitude = b. Period = c. Vertical Shift = d. Phase Shift = e. Sketch graph of y, label at least two distinct points (x, y) on the graph: 61 4 N 2 4 6 8 10 -10 -8...
 3. Graph each of the exponential functions below. Make a table of values for each one that contains a minimum of 5 points. a. S(x)=4 b. f(x)=e" +1 c. f(x) = 2x+1 d. f(x) = log3x
 Use the graph of y=e* and transformations to sketch the exponential function f(x) = new Determine the domain and range. Also, determine the y-intercept, and find the equation of the horizontal asymptote. Use the coordinates of the three points of the graph of y=e* to determine the corresponding points that lie on the graph of f(x) = -ex+6 Points that lie on the graph of y=e Points that lie on the graph of y=e* (-2,5) (0,1) (1,) Corresponding points that...
 Sketch a graph of the following functions; assume that x is in degrees and be sure to label your axes. Additionally, give their midline and amplitude. (A.) f(x) = 3 cos(x) — 3 (B.) g(x) = sin(x) + 2 (c.) h(x) = 5 cos(x) – 7 (n.) p(x) = sin(x) + 3
 2. Use the information in the charts to answer the following questions and sketch the graph of the function f(x) a) List all the critical points (both coordinates) and classify them as max, min, or neither b) List all the inflection points - ND + + ND - 0 + S. Sketch the graph of each given function by doing the following (box your answer to each of the questions) 1. Determine the domain of the function. Use limits to...
 5. Letf(x) = x3 + x2 - x - 1. a. 6 pts Find all critical values off. Show all work. Answers from a graph will not receive full credit. b. 6 pts Make a sign chart for f'(x). c. 4 pts List the x and y coordinates of all local maxima and minima on the graph off. Clearly identify if the point is a maximum or minimum. d. 6 pts Make a sign chart for f'(x). e. 4 pts...
 Show all of your work. Label the axes and scale on your graph. The sketch should include at least three . to five points including the points of intersection and at least one point in between The integration techniques used should be clear and easy to follow step by step with all techniques shown in detail, including the substitution method. . . All steps must be shown in your own writing to receive any credit. Circle or box your final...
 11. Find the CTFT for the following functions. Sketch and label the magnitude response of each transform. (a) f(t) = една(--t + 1) (b) f(t) = e-31 [u(t + 2) _ u(1-3)| (c), f(t) = e-3n sin (2t).
 Sketch the graph of the exponential function. f(x) = 3X Complete the table of coordinates. x -2 -1 0 1 | 2 | y 0.111 0.333 1 3 9 (Simplify your answers. Type integers or fractions.)
 TEX Sketch the graph, and include at least two periods for the function without a calculator: f(x) = 4 cos + ) | – 2. Also, indicate the amplitude, period, vertical shift and phase shift for f(x). (8 points) 2 a. Amplitude = b. Period = c. Vertical Shift = d. Phase Shift = e. Sketch graph of y, label at least two distinct points (x, y) on the graph: 61 4 N 2 4 6 8 10 -10 -8...
Most questions answered within 3 hours.
-
Why is the answer b), for this question? I came up with C) for
my incorrect...
asked 3 minutes ago -
Suppose that you know that in the population of full-time
employees in the United States, the...
asked 25 minutes ago -
This experiment was designed originally to sample various meat and carcass quality
aspects of Ontario pigs...
asked 26 minutes ago -
Dopamine Hydrochloride: draw the structure And Show the
functional groups in different colors and label the...
asked 18 minutes ago -
A rope supports a 10 kg dumbbell hanging from it. What is the
tension in the...
asked 17 minutes ago -
) Raw materials are studied for contamination. Suppose that
the number of particles of contamination per...
asked 40 minutes ago -
After running a regression analysis we calculated an F test and
the significance level was 0.15....
asked 36 minutes ago -
----Can someone please help me solve this one using JAVA
----I thank you in advance
Create...
asked 40 minutes ago -
1. What force primarily attracts the potassium ion to
the nitrate ion?
a. London forces...
asked 42 minutes ago -
What are the negative effects of abruptly stopping the use of
all fossil fuels? Give at...
asked 49 minutes ago -
Given that many conflict are the result of different parties having
different interests, is it possible...
asked 54 minutes ago -
A 750 g block can slide uniformly along the horizontal track
when a string attached to...
asked 57 minutes ago