need help with mathematics assignment.

here is the extra information
Homework Answers


Add Answer to:
need help with mathematics assignment.
here is the extra information
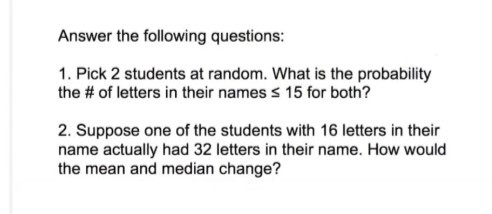
Answer the following questions: 1. Pick...
For the data listed(assume sample). a.) Find the following: Mean Mode Median Midrange Range Quartiles Variance...
For the data listed(assume sample). a.) Find the following: Mean Mode Median Midrange Range Quartiles Variance Standard Deviation BoxPlot b.) Create a frequency distribution When creating classes use the formula from the Notes on how classes to create. 17 23 14 16 12 26 20 22 14 15 22 18 18 21 21 19 15 21 18 17 15 25 14 30 16 10 20 12 16 17.44 16 14 15 20 20 16 17 16 15 15 19 48...
True or False 1 point each) (Correct the ones that are false, carn an extra credit point for each...
 True or False 1 point each) (Correct the ones that are false, carn an extra credit point for each.) The statistical method appropriate for summarizing data depends on whether the data are categorical or quantitative. Whenever a dataset contains extreme values, the mean is preferred over the median as a mcasure ot central location. 1. 2. 3. The recommended number of classes for a frequency distribution is 8. 4. A ste and leaf display can show rank order and shape...
Here is a chart depicting some of the data I collected at the beginning of the...
Here is a chart depicting some of the data I collected at the beginning of the semester. ID# What is your GPA? What grade are you in? How many books have you read this year? 1 3.74 Sophomore 8 2 3.07 Junior 2 3 3.2 Junior 5 4 3.5 Freshman 10 5 2.75 Freshman 1 6 2.6 Senior 2 7 2.72 Junior 8 8 3.4 Junior 3 9 4 Freshman 3 10 3 Junior 3 11 3.2 Senior 2 12...
True or False 1 point each) (Correct the ones that are false, carn an extra credit...
 True or False 1 point each) (Correct the ones that are false, carn an extra credit point for each.) The statistical method appropriate for summarizing data depends on whether the data are categorical or quantitative. Whenever a dataset contains extreme values, the mean is preferred over the median as a mcasure ot central location. 1. 2. 3. The recommended number of classes for a frequency distribution is 8. 4. A ste and leaf display can show rank order and shape...
QUESTION1 Use the following scenatio and data for all the questions The daily sales of specific...
 QUESTION1 Use the following scenatio and data for all the questions The daily sales of specific model of laptop computers at an electronics store are recorded for the last two weeks. Treat these observations as a random sample. The results are listed in the following. Note that the sample data are not arranged in any order 18 15 13 17 8 16 17 15 17 19 21 11 12 11 You may use the following table to do the necessary...
SEED NUMBER: 3932 3.) For this problem you need to generate data so open the probability...
 SEED NUMBER: 3932
3.) For this problem you need to generate data so open the probability simulator on the TI calculator and set your seed (Use last 4 digits of your GCID). Select the Roll Dice simulator and set the number of trials to 16, and the number of Sides to 12. Execute Roll and save Data to a list. PROB SIM APP Call the corresponding random variable X. Settings Trial Set: 16 Dice: 1 2 3 Sides: 6 8...
SEED NUMBER: 3932
3.) For this problem you need to generate data so open the probability simulator on the TI calculator and set your seed (Use last 4 digits of your GCID). Select the Roll Dice simulator and set the number of trials to 16, and the number of Sides to 12. Execute Roll and save Data to a list. PROB SIM APP Call the corresponding random variable X. Settings Trial Set: 16 Dice: 1 2 3 Sides: 6 8...
1. Given below are marks obtained by 20 students out of 25 in Mathematics test. 21...
 1. Given below are marks obtained by 20 students out of 25 in Mathematics test. 21 23 19 17 12 15 15 17 17 19 23 23 21 21 25 25 21 19 19 19 Calculate: i. measures of central tendency. (9 marks) ii. range and semi inter-quartile range. (6 marks) iii. variance and determine the shape of skewness. (5 marks) (b) A factory produces components of which 1% is defective. The components are packed in boxes of 10. A...
I need the answer for this puzzle please Name HLTH8005 nal Pharmacy Technician Drug Information Assignment...
 I need the answer for this puzzle please
Name HLTH8005 nal Pharmacy Technician Drug Information Assignment #2 2 6 9 10 12 15 14 13 16 17 18 Down Across 2. PRIMIDONE 1. LAMOTRIGINE 6. MIDODRINE 9. MEM LoL. 4. LEVETIRACETAM 5. CARDURA 7. GALANTAMINE 12. GABITRIL 13. METHYLPHENIDATE 15. FELBAMATE 8. ARTANE 10 RENOBARBITAL 17. PHENYTOIN 18. SECTRAL 16. PINDOLOL
I need the answer for this puzzle please
Name HLTH8005 nal Pharmacy Technician Drug Information Assignment #2 2 6 9 10 12 15 14 13 16 17 18 Down Across 2. PRIMIDONE 1. LAMOTRIGINE 6. MIDODRINE 9. MEM LoL. 4. LEVETIRACETAM 5. CARDURA 7. GALANTAMINE 12. GABITRIL 13. METHYLPHENIDATE 15. FELBAMATE 8. ARTANE 10 RENOBARBITAL 17. PHENYTOIN 18. SECTRAL 16. PINDOLOL
3.) For this problem you need to generate data so open the probability simulator on the...
 3.) For this problem you need to generate data so open the probability simulator on the TI calculator and set your seed (Use last 4 digits of your GCID). Select the Roll Dice simulator and set the number of trials to 16, and the number of Sides to 12. Execute Roll and save Data to a list. PROB SIM APP Call the corresponding random variable X. Settings Trial Set: 16 Dice: 1 2 3 Sides: 6 8 10 12 20...
I need help answering the questions below. Please help :) Graph the frequency distribution as a...
I need help answering the questions below. Please help :) Graph the frequency distribution as a histogram graph. Carry all calculations and the answer to 4 decimal places unless otherwise noted. For example, the number "123.0000" has been carried and reported to 4 decimal places. (Yes, trailing zeros count.) The Countrytown School District has recorded the number of absences in a school year for a random sample of 24 students. The school board is concerned that half of their students...
 True or False 1 point each) (Correct the ones that are false, carn an extra credit point for each.) The statistical method appropriate for summarizing data depends on whether the data are categorical or quantitative. Whenever a dataset contains extreme values, the mean is preferred over the median as a mcasure ot central location. 1. 2. 3. The recommended number of classes for a frequency distribution is 8. 4. A ste and leaf display can show rank order and shape...
 True or False 1 point each) (Correct the ones that are false, carn an extra credit point for each.) The statistical method appropriate for summarizing data depends on whether the data are categorical or quantitative. Whenever a dataset contains extreme values, the mean is preferred over the median as a mcasure ot central location. 1. 2. 3. The recommended number of classes for a frequency distribution is 8. 4. A ste and leaf display can show rank order and shape...
 QUESTION1 Use the following scenatio and data for all the questions The daily sales of specific model of laptop computers at an electronics store are recorded for the last two weeks. Treat these observations as a random sample. The results are listed in the following. Note that the sample data are not arranged in any order 18 15 13 17 8 16 17 15 17 19 21 11 12 11 You may use the following table to do the necessary...
 SEED NUMBER: 3932
3.) For this problem you need to generate data so open the probability simulator on the TI calculator and set your seed (Use last 4 digits of your GCID). Select the Roll Dice simulator and set the number of trials to 16, and the number of Sides to 12. Execute Roll and save Data to a list. PROB SIM APP Call the corresponding random variable X. Settings Trial Set: 16 Dice: 1 2 3 Sides: 6 8...
SEED NUMBER: 3932
3.) For this problem you need to generate data so open the probability simulator on the TI calculator and set your seed (Use last 4 digits of your GCID). Select the Roll Dice simulator and set the number of trials to 16, and the number of Sides to 12. Execute Roll and save Data to a list. PROB SIM APP Call the corresponding random variable X. Settings Trial Set: 16 Dice: 1 2 3 Sides: 6 8...
 1. Given below are marks obtained by 20 students out of 25 in Mathematics test. 21 23 19 17 12 15 15 17 17 19 23 23 21 21 25 25 21 19 19 19 Calculate: i. measures of central tendency. (9 marks) ii. range and semi inter-quartile range. (6 marks) iii. variance and determine the shape of skewness. (5 marks) (b) A factory produces components of which 1% is defective. The components are packed in boxes of 10. A...
 I need the answer for this puzzle please
Name HLTH8005 nal Pharmacy Technician Drug Information Assignment #2 2 6 9 10 12 15 14 13 16 17 18 Down Across 2. PRIMIDONE 1. LAMOTRIGINE 6. MIDODRINE 9. MEM LoL. 4. LEVETIRACETAM 5. CARDURA 7. GALANTAMINE 12. GABITRIL 13. METHYLPHENIDATE 15. FELBAMATE 8. ARTANE 10 RENOBARBITAL 17. PHENYTOIN 18. SECTRAL 16. PINDOLOL
I need the answer for this puzzle please
Name HLTH8005 nal Pharmacy Technician Drug Information Assignment #2 2 6 9 10 12 15 14 13 16 17 18 Down Across 2. PRIMIDONE 1. LAMOTRIGINE 6. MIDODRINE 9. MEM LoL. 4. LEVETIRACETAM 5. CARDURA 7. GALANTAMINE 12. GABITRIL 13. METHYLPHENIDATE 15. FELBAMATE 8. ARTANE 10 RENOBARBITAL 17. PHENYTOIN 18. SECTRAL 16. PINDOLOL
 3.) For this problem you need to generate data so open the probability simulator on the TI calculator and set your seed (Use last 4 digits of your GCID). Select the Roll Dice simulator and set the number of trials to 16, and the number of Sides to 12. Execute Roll and save Data to a list. PROB SIM APP Call the corresponding random variable X. Settings Trial Set: 16 Dice: 1 2 3 Sides: 6 8 10 12 20...
Most questions answered within 3 hours.
-
Determine the temperature (in Celsius) at which 1.00 mole of an
ideal gas will have a...
asked 19 minutes ago -
Japan’s combination of X and Y
Canada’s combination of X and Y
100x and 0y
50x...
asked 12 minutes ago -
[1] Household statistics include individuals living alone or in
groups in:
A) apartments.
B) military barracks....
asked 22 minutes ago -
What is the % w/v when 80 mL of a 2.0% solution is mixed with 50...
asked 26 minutes ago -
How can I solve the following using a TI83
Claim: Most adults would erase all of...
asked 38 minutes ago -
Analysis of 3-ethyl-3-buten-2-ol gave C, 72.13%; H, 11.92%.
Calculate the percent deviation of these results from...
asked 35 minutes ago -
Which VALS segment is most likely to have a top of the line
brand new (2015)...
asked 39 minutes ago -
Write a program to score the paper-rock-scissor game. Each of
two users types in either P,R...
asked 59 minutes ago -
Calculate the equillibrium constent K for a redox reaction that
has E°cell = -.98 V at...
asked 1 hour ago -
A concave spherical mirror has a radius of curvature of
magnitude 19.6 cm.
(a) Find the...
asked 1 hour ago -
3. draw a diagram of the magnetic field:
a. around a long straight wire with a...
asked 1 hour ago -
If you titrated 30.0 mL of 0.1 M HCl with 0.1 M NaOH, indicate
the approximate...
asked 1 hour ago