


Homework Answers
(a)
Here we are to test if the after value is more. Hence the correct set of hypotheses is given in third option. The correct option is third option
(b)
The table is made as
| Before | After | Difference |
| 2.5 | 2.9 | 0.4 |
| 1.8 | 3.1 | 1.3 |
| 1.4 | 3.9 | 2.5 |
| -2.9 | -1.8 | 1.1 |
| 1.2 | 0.2 | -1 |
| -1.9 | 0.6 | 2.5 |
| -3.1 | 2.5 | 5.6 |
| 2.5 | 2.9 | 0.4 |
The data is summarized as follows:
| Sample Size(n) | 8 |
Sample mean ( ) ) |
1.6 |
| Sample SD(s) | 1.985663=1.9857 |
The test statistic is given by

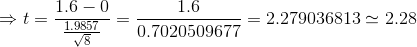
(c)
The test statistic follows t distribution with df 7 under the null hypothesis. The p-value is obtained as 0.02836 . Thus the correct option is the third option
(d)
We reject H0. At the 5% significance level, we can conclude that the experiment increases the value of the observations.
(e)
The p-value is less than 0.05 and hence the null hypothesis is rejected at 5% level of significance. But the p-value is more than 0.01 and hence the null hypothesis cannot be rejected at 1% level of significance. Hence the correct answer is yes
Hopefully this will help you. In case of any query, do comment. If you are satisfied with the answer, give it a like. Thanks.
Add Answer to:
Consider the following matched-pairs sample that represents observations before and after an experiment. Assume that the...
In order to conduct a hypothesis test for the population proportion, you sample 440 observations that...
 In order to conduct a hypothesis test for the population proportion, you sample 440 observations that result in 220 successes. (You may find it useful to reference the appropriate table: z table or t table Ho: p 0.52; HA: P 0.52 a-1. Calculate the value of the test statistic. (Negative value should be indicated by a minus sign. Round intermediate calculations to at least 4 decimal places and final answer to 2 decimal places.) Test statistic a-2. Find the p-value....
In order to conduct a hypothesis test for the population proportion, you sample 320 observations that...
 In order to conduct a hypothesis test for the population proportion, you sample 320 observations that result in 128 successes.(You may find it useful to reference the appropriate table: z table or t table HO pz 0.45; HA: p < 0.45. a-1. Calculate the value of the test statistic. (Negative value should be indicated by a minus sign. Round intermediate calculations to at least 4 decimal places and final answer to 2 decimal places.) est statistic a-2. Find the p-value....
n order to conduct a hypothesis test for the population proportion, you sample 480 observations that...
 n order to conduct a hypothesis test for the population proportion, you sample 480 observations that result in 264 successes. (You may find it useful to reference the appropriate table: z table or t table) Ho: pz 0.60 HA: p0.60 a-1. Calculate the value of the test statistic. (Negative value should be indicated by a minus sign. Round intermediate calculations to at least 4 decimal places and final answer to 2 decimal places.) Test statistic 2.24 a-2. Find the p-value....
In order to conduct a hypothesis test for the population proportion, you sample 300 observations that...
 In order to conduct a hypothesis test for the population proportion, you sample 300 observations that result in 111 successes. (You may find it useful to reference the appropriate table: z table or t table) HO : p o.41; HA p< 0.41. a-1. Calculate the value of the test statistic. (Negative value should be indicated by a minus sign. Round intermediate calculations to at least 4 decimal places and final answer to 2 decimal places.) Test statistic a-2. Find the...
Consider the following hypotheses: HO: 220 HA u < 220 A sample of 72 observations results...
 Consider the following hypotheses: HO: 220 HA u < 220 A sample of 72 observations results in a sample mean of 209. The population standard deviation is known to be 18. (You may find it useful to reference the appropriate table: z table or tablet a-1. Calculate the value of the test statistic. (Negative value should be indicated by a minus sign. Round intermediate calculations to at least 4 decimal places and final answer to 2 decimal places.) Test statistic...
Consider the following hypotheses: HO: > 220 HA: U <220 A sample of 72 observations results...
 Consider the following hypotheses: HO: > 220 HA: U <220 A sample of 72 observations results in a sample mean of 209. The population standard deviation is known to be 18. (You may find it useful to reference the appropriate table: z table or t table) a-1. Calculate the value of the test statistic. (Negative value should be indicated by a minus sign. Round intermediate calculations to at least 4 decimal places and final answer to 2 decimal places.) Test...
Consider the following competing hypotheses: H0: ρxy ≥ 0 HA: ρxy < 0 The sample consists of 30 observations and the sample correlation coefficient is –0.46. [You may find it useful to reference t...
 Consider the following competing hypotheses:
H0: ρxy ≥ 0
HA: ρxy < 0
The sample consists of 30 observations and the sample correlation
coefficient is –0.46. [You may find it useful to reference
the t table.]
a-1. Calculate the value of the test statistic.
(Round intermediate calculations to at least 4 decimal
places and final answer to 3 decimal places.)
a-2. Find the p-value.
p-value < 0.01
p-value
0.10
0.05
p-value < 0.10
0.025
p-value < 0.05
0.01
p-value <...
Consider the following competing hypotheses:
H0: ρxy ≥ 0
HA: ρxy < 0
The sample consists of 30 observations and the sample correlation
coefficient is –0.46. [You may find it useful to reference
the t table.]
a-1. Calculate the value of the test statistic.
(Round intermediate calculations to at least 4 decimal
places and final answer to 3 decimal places.)
a-2. Find the p-value.
p-value < 0.01
p-value
0.10
0.05
p-value < 0.10
0.025
p-value < 0.05
0.01
p-value <...
In order to conduct a hypothesis test for the population proportion, you sample 440 observations that...
 In order to conduct a hypothesis test for the population proportion, you sample 440 observations that result in 220 successes. (You may find it useful to reference the appropriate table: z table or table) He: p > 0.52; HA: p < 0.52. a-1. Calculate the value of the test statistic, (Negative value should be indicated by a minus sign. Round intermediate calculations to at least 4 decimal places and final answer to 2 decimal places.) Test statistic a-2. Find the...
In order to conduct a hypothesis test for the population mean, a random sample of 20...
 In order to conduct a hypothesis test for the population mean, a random sample of 20 observations is drawn from a normally distributed population. The resulting sample mean and sample standard deviation are calculated as 12.9 and 2.4, respectively. (You may find it useful to reference the appropriate table: z table or ttable). Ho : μ 12.1 against HA: μ > 12.1 a-1. Calculate the value of the test statistic. (Round all intermediate calculations to at least 4 decimal places...
Consider the following hypotheses: Ho: μ 12.6 HA: μ> 12.6 A sample of 25 observations yields...
 Consider the following hypotheses: Ho: μ 12.6 HA: μ> 12.6 A sample of 25 observations yields a sample mean of 13.4. Assume that the sample is drawn from a normal population with a population standard deviation of 3.2. (You may find it useful to reference the appropriate table: z table or t table a-1. Find the p-value. p-value < 0.01 0.01 s p-value0.025 0.025 s 0.025 s p-value< 0.05 O.05 s p-value<0.10 。p-value 20.10 a-2 what is the conclusion if...
 In order to conduct a hypothesis test for the population proportion, you sample 440 observations that result in 220 successes. (You may find it useful to reference the appropriate table: z table or t table Ho: p 0.52; HA: P 0.52 a-1. Calculate the value of the test statistic. (Negative value should be indicated by a minus sign. Round intermediate calculations to at least 4 decimal places and final answer to 2 decimal places.) Test statistic a-2. Find the p-value....
 In order to conduct a hypothesis test for the population proportion, you sample 320 observations that result in 128 successes.(You may find it useful to reference the appropriate table: z table or t table HO pz 0.45; HA: p < 0.45. a-1. Calculate the value of the test statistic. (Negative value should be indicated by a minus sign. Round intermediate calculations to at least 4 decimal places and final answer to 2 decimal places.) est statistic a-2. Find the p-value....
 n order to conduct a hypothesis test for the population proportion, you sample 480 observations that result in 264 successes. (You may find it useful to reference the appropriate table: z table or t table) Ho: pz 0.60 HA: p0.60 a-1. Calculate the value of the test statistic. (Negative value should be indicated by a minus sign. Round intermediate calculations to at least 4 decimal places and final answer to 2 decimal places.) Test statistic 2.24 a-2. Find the p-value....
 In order to conduct a hypothesis test for the population proportion, you sample 300 observations that result in 111 successes. (You may find it useful to reference the appropriate table: z table or t table) HO : p o.41; HA p< 0.41. a-1. Calculate the value of the test statistic. (Negative value should be indicated by a minus sign. Round intermediate calculations to at least 4 decimal places and final answer to 2 decimal places.) Test statistic a-2. Find the...
 Consider the following hypotheses: HO: 220 HA u < 220 A sample of 72 observations results in a sample mean of 209. The population standard deviation is known to be 18. (You may find it useful to reference the appropriate table: z table or tablet a-1. Calculate the value of the test statistic. (Negative value should be indicated by a minus sign. Round intermediate calculations to at least 4 decimal places and final answer to 2 decimal places.) Test statistic...
 Consider the following hypotheses: HO: > 220 HA: U <220 A sample of 72 observations results in a sample mean of 209. The population standard deviation is known to be 18. (You may find it useful to reference the appropriate table: z table or t table) a-1. Calculate the value of the test statistic. (Negative value should be indicated by a minus sign. Round intermediate calculations to at least 4 decimal places and final answer to 2 decimal places.) Test...
 Consider the following competing hypotheses:
H0: ρxy ≥ 0
HA: ρxy < 0
The sample consists of 30 observations and the sample correlation
coefficient is –0.46. [You may find it useful to reference
the t table.]
a-1. Calculate the value of the test statistic.
(Round intermediate calculations to at least 4 decimal
places and final answer to 3 decimal places.)
a-2. Find the p-value.
p-value < 0.01
p-value
0.10
0.05
p-value < 0.10
0.025
p-value < 0.05
0.01
p-value <...
Consider the following competing hypotheses:
H0: ρxy ≥ 0
HA: ρxy < 0
The sample consists of 30 observations and the sample correlation
coefficient is –0.46. [You may find it useful to reference
the t table.]
a-1. Calculate the value of the test statistic.
(Round intermediate calculations to at least 4 decimal
places and final answer to 3 decimal places.)
a-2. Find the p-value.
p-value < 0.01
p-value
0.10
0.05
p-value < 0.10
0.025
p-value < 0.05
0.01
p-value <...
 In order to conduct a hypothesis test for the population proportion, you sample 440 observations that result in 220 successes. (You may find it useful to reference the appropriate table: z table or table) He: p > 0.52; HA: p < 0.52. a-1. Calculate the value of the test statistic, (Negative value should be indicated by a minus sign. Round intermediate calculations to at least 4 decimal places and final answer to 2 decimal places.) Test statistic a-2. Find the...
 In order to conduct a hypothesis test for the population mean, a random sample of 20 observations is drawn from a normally distributed population. The resulting sample mean and sample standard deviation are calculated as 12.9 and 2.4, respectively. (You may find it useful to reference the appropriate table: z table or ttable). Ho : μ 12.1 against HA: μ > 12.1 a-1. Calculate the value of the test statistic. (Round all intermediate calculations to at least 4 decimal places...
 Consider the following hypotheses: Ho: μ 12.6 HA: μ> 12.6 A sample of 25 observations yields a sample mean of 13.4. Assume that the sample is drawn from a normal population with a population standard deviation of 3.2. (You may find it useful to reference the appropriate table: z table or t table a-1. Find the p-value. p-value < 0.01 0.01 s p-value0.025 0.025 s 0.025 s p-value< 0.05 O.05 s p-value<0.10 。p-value 20.10 a-2 what is the conclusion if...
Most questions answered within 3 hours.
-
A motor produces a torque of 0.25 N m at an angular velocity of
7200 revolutions...
asked 6 minutes ago -
***Please answer the below java question***
Are static methods inheritable? Can they be overridden?
asked 8 minutes ago -
In reaching her destination, a backpacker walks with an average
velocity of 1.13 m/s, due west....
asked 8 minutes ago -
Write two C programs that run a
server program and a client program concurrently.
Server program:...
asked 7 minutes ago -
Executive Program Practical Connection Assignment
Subject : Operations Security.
Assignment:
Provide a reflection of at least...
asked 17 minutes ago -
Every time Casey is at bat he has a 0.4 probability of
getting on base (assume...
asked 25 minutes ago -
The Walston Company is to be liquidated and has the following
liabilities:
Income taxes
$
9,400...
asked 32 minutes ago -
If
the more comprehensive data is available in MEPS, why does the NHIS
still exist? How...
asked 54 minutes ago -
Koo argues that the Japanese economy in the 1990s suffered from
a balance sheet recession. What...
asked 47 minutes ago -
Automobile mechanics conduct diagnosis tests on 150 new cars of
particular make and model to determine...
asked 41 minutes ago -
11) Find the proceeds of a 5 year non-interest
bearing note for $6500 discounted 2.5 years...
asked 48 minutes ago -
Required: Prepare the consolidated financial statements of
Griffin Ltd at 30 June 2019.
Griffin Ltd is...
asked 57 minutes ago