The data found below measure the amounts of greenhouse gas emissions from three types of vehicles....
The data found below measure the amounts of greenhouse gas emissions from three types of vehicles. The measurements are in tons per year, expressed as CO2 equivalents. Use a 0.025 significance level to test the claim that the different types of vehicle have the same mean amount of greenhouse gas emissions. Based on the results, does the type of vehicle appear to affect the amount of greenhouse gas emissions? LOADING... Click the icon to view the data. Type A 6.9 6.9 7.4 6.9 7.6 6.9 6.5 7.7 6.9 6.3 Type B 8.1 7.2 7.3 7.6 8.8 9.1 8.8 8.7, Type C 8.4 9.7 8.3 9.9 8.9 9.2 9.8 9.3 9.1
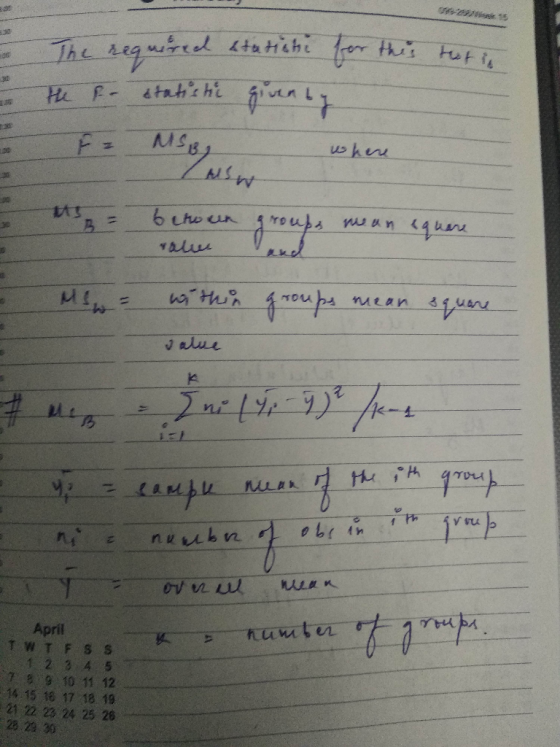
I need the the std. test statistic and explanation on how to come up with this number and critical values plus the determination on whether to reject or not to reject the hypothesis
Homework Answers


 There is a lot of information
on this test
There is a lot of information
on this test
Search F test on Google and you will get.
If you know about Expected value in statistics,
Then I will add one more thing:
Under H0, Expected value of numerator and denominator in the statistic is supposed to be (sigma)^2. So if H0 is true, the value of the test statistic will be small and hence we will not reject the null hypothesis and claim that it is true.
When to use the F test?
When you will find that you want to test the difference in effects of the same factor,
Suppose you have factor 1: vehicle of type 1
and factor 2: coal of type 1
Then they cannot be tested by ANOVA
But when you are having
Factor 1: vehicle 1
......
Factor n: vehicle n
Then you can do one way ANOVA to test whether all the vehicles type have same of different effects.
We will basically test whether the means of each group are different or same.(Means because we can compare the means of each group)
What is the critical value?
On getting the value of F Statistic, we need to compare it with a value to see whether to accept or reject the null hypothesis.
Now at 0.025 level of significance,
We have under H0
P(F (2,21)>k) = 0.025
So k= F (0.025,2,21)
So k is the critical value above which we will reject the null hypothesis.
Add Answer to:
The data found below measure the amounts of greenhouse gas
emissions from three types of vehicles....
The data found below measure the amounts of greenhouse gas emissions from three types of vehicles....
The data found below measure the amounts of greenhouse gas emissions from three types of vehicles. The measurements are in tons per year, expressed as CO2 equivalents. Use a 0.025 significance level to test the claim that the different types of vehicle have the same mean amount of greenhouse gas emissions. Based on the results, does the type of vehicle appear to affect the amount of greenhouse gas emissions? Data: Type A: 5.9,6.4,6.3,7.2,6.2,6.3,5.8,6.6,7.2,6.3 Type B: 8.4, 7.9, 8.4, 9.2, 8.9,...
2.1.12-T Question Help The data found below measure the amounts of greenhouse gas emissions from three...
 2.1.12-T Question Help The data found below measure the amounts of greenhouse gas emissions from three types of vehicles. The measurements are in tons per year, expressed as CO2 equivalents. Use a 0.05 significance greenhouse gas emissions? level to test the claim that the different types of vehicle have the same mean amount of greenhouse gas emissions. Based on the results, does the type of vehicle appear to affect the amount of Click the icon to view the data. What...
Question Help . The data found below measure the amounts of greenhouse gas emissions from three...
 Question Help . The data found below measure the amounts of greenhouse gas emissions from three types of vehicles. The measurements are in tons per year, expressed as CO2 equivalents. Use a 0.05 significance level to test the claim that the different types of vehicle have the same mean amount of greenhouse gas emissions. Based on the results, does the type of vehicle appear to affect the amount of greenhouse gas emissions? Click the icon to view the data. What...
The data found below measure the amounts of greenhouse gas emissions from three types of vehicles....
 The data found below measure the amounts of greenhouse gas emissions from three types of vehicles. The measurements are in tons per yox, expressed as CO2 equalents to a 0. Os significance level to test the claw that the diferent types of which the same man amount of greenhouse gas emissions. Based on the results, does the type of vehicle appear to affect the amount of greenhouse gas emissions Click the icon to the Twwcomwww.mmasisanerencromineers 1 Data Table OCH, At...
Question Help The data found below measure the amounts of greenhouse gas emissions from three types...
 Question Help The data found below measure the amounts of greenhouse gas emissions from three types of vehicles. The measurements are in tons per year expressed as CO2 equivalents Use a 005 significance level to test the claim that the different types of vehicle have the same mean amount of greenhouse gas emissions. Based on the results, does the type of vehicle appear to affect the amount of greenhouse gas emissions? III Click the icon to view the data What...
Compute the correlation coefficient, r, for all five variables (columns). Interpret your findings whether you have determined any relationship between variables. X1 X2 X3 X4 X5 The data (X1, X...
Compute the correlation coefficient, r, for all five variables (columns). Interpret your findings whether you have determined any relationship between variables. X1 X2 X3 X4 X5 The data (X1, X2, X3, X4, X5) are by city. 8 78 284 9.1 109 X1 = death rate per 1000 residents 9.3 68 433 8.7 144 X2 = doctor availability per 100,000 residents 7.5 70 739 7.2 113 X3 = hospital availability per 100,000 residents 8.9 96 1792 8.9 97 X4 = annual...
1) Do you think there is a linear correlation between Movie Ratings and their Runtimes?
Movie Ratings8.78.97.67.27.28.18.86.88.79.08.57.98.79.19.07.28.47.57.79.09.38.76.99.28.49.29.09.18.98.29.48.38.17.99.18.78.67.88.47.8Movie runtimes201124136155131161110132116136911279612612913512411617012117511818911713610819589881221191161261151531431181291441321) Do you think there is a linear correlation between Movie Ratings and their Runtimes? Explain why or why not before doing any work!2) Is there a linear correlation between the data based on the correlation coefficient? Explain.3) Find the linear regression line and explain what it means in English.4) Perform a hypothesis test at the 5% level of significance to see if a correlation is significant.
The following data represent soil water content (percentage of water by volume) for independent random samples...
The following data represent soil water content (percentage of water by volume) for independent random samples of soil taken from two experimental fields growing bell peppers. Soil water content from field I: x1; n1 = 72 15.2 11.3 10.1 10.8 16.6 8.3 9.1 12.3 9.1 14.3 10.7 16.1 10.2 15.2 8.9 9.5 9.6 11.3 14.0 11.3 15.6 11.2 13.8 9.0 8.4 8.2 12.0 13.9 11.6 16.0 9.6 11.4 8.4 8.0 14.1 10.9 13.2 13.8 14.6 10.2 11.5 13.1 14.7 12.5...
Compute Regression Analysis for following relationship: The relationship between death rate X1 (USD) vs. population density...
Compute Regression Analysis for following relationship: The relationship between death rate X1 (USD) vs. population density X5. Population as a Predictor, X, then death rate as a Response variable, Y. Get Regression Output, and Scatter plot between these variables and compute Coefficient of Determination, R2, and Interpret your findings. X1 X2 X3 X4 X5 The data (X1, X2, X3, X4, X5) are by city. 8 78 284 9.1 109 X1 = death rate per 1000 residents 9.3 68 433 8.7 144...
1. The numbers below represent heights (in feet) of 3-year old elm trees. 5.1, 5.5, 5.8,...
1. The numbers below represent heights (in feet) of 3-year old elm trees. 5.1, 5.5, 5.8, 6.1, 6.2, 6.4, 6.7, 6.8, 6.9, 7.0, 7.2, 7.3, 7.3, 7.4, 7.5, 7.7, 7.9, 8.1, 8.1, 8.2, 8.3, 8.5, 8.6, 8.6, 8.7, 8.7, 8.9, 8.9, 9.0, 9.1, 9.3, 9.4, 9.6, 9.8, 10.0, 10.2, 10.2 Using the chi-square goodness-of-fit test, determine whether the heights of 3-year old elm trees are normally distributed, at the a = .05 significance level. Also, find the p- value.
 2.1.12-T Question Help The data found below measure the amounts of greenhouse gas emissions from three types of vehicles. The measurements are in tons per year, expressed as CO2 equivalents. Use a 0.05 significance greenhouse gas emissions? level to test the claim that the different types of vehicle have the same mean amount of greenhouse gas emissions. Based on the results, does the type of vehicle appear to affect the amount of Click the icon to view the data. What...
 Question Help . The data found below measure the amounts of greenhouse gas emissions from three types of vehicles. The measurements are in tons per year, expressed as CO2 equivalents. Use a 0.05 significance level to test the claim that the different types of vehicle have the same mean amount of greenhouse gas emissions. Based on the results, does the type of vehicle appear to affect the amount of greenhouse gas emissions? Click the icon to view the data. What...
 The data found below measure the amounts of greenhouse gas emissions from three types of vehicles. The measurements are in tons per yox, expressed as CO2 equalents to a 0. Os significance level to test the claw that the diferent types of which the same man amount of greenhouse gas emissions. Based on the results, does the type of vehicle appear to affect the amount of greenhouse gas emissions Click the icon to the Twwcomwww.mmasisanerencromineers 1 Data Table OCH, At...
 Question Help The data found below measure the amounts of greenhouse gas emissions from three types of vehicles. The measurements are in tons per year expressed as CO2 equivalents Use a 005 significance level to test the claim that the different types of vehicle have the same mean amount of greenhouse gas emissions. Based on the results, does the type of vehicle appear to affect the amount of greenhouse gas emissions? III Click the icon to view the data What...
Most questions answered within 3 hours.
-
Do not neglect the old for the new. The existing business must
not lose priority simply...
asked 1 hour ago -
Kylie is a single mom with two dependent children,
Tanner, age 7 and Olivia, age 11....
asked 2 hours ago -
Phosphorous + bromine = phosphorous tribromide. If 35.0 g of
bromine are reacted and 27.9 grams...
asked 4 hours ago -
Derive the long wavelength limit of the Planck energy density
distribution
asked 3 hours ago -
Calculate the pH of each of the following solutions.
0.50 M HBr
3.1×10⁻⁴ M KOH
4.2×10⁻⁵...
asked 7 hours ago -
For the year ended December 31, Depot Max’s cost of merchandise
sold was $85,600. Inventory at the...
asked 7 hours ago -
Week 10 - Professional Memo Assignment
Professional Memo Assignment
Your mission for this week, should you...
asked 7 hours ago -
Write a Python program that stores the data for each
player on the team, and it...
asked 7 hours ago -
In
the last 3 months, mike never knows when he is going to get his
allowance...
asked 8 hours ago -
Is Ca(OH)2 a Bronsted base, Lewis base, or both? Why?
asked 8 hours ago -
1A- Why don’t voters complain about U.S. tariffs on imported
sugar?
Because sugar is only a...
asked 8 hours ago -
Cash Payback Period
Primera Banco is evaluating two capital investment proposals for
a drive-up ATM kiosk,...
asked 8 hours ago