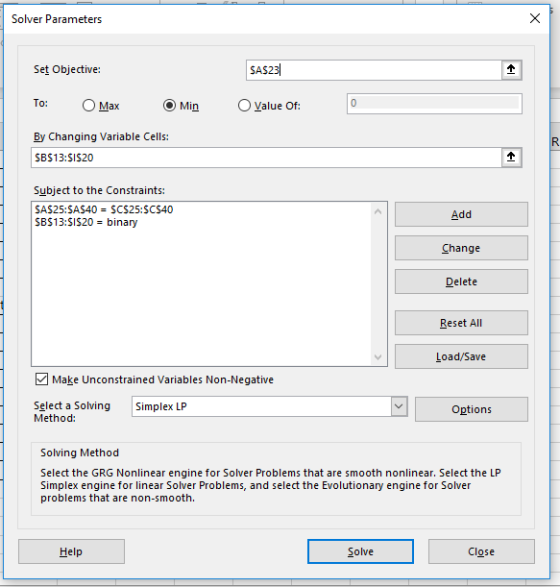
Below is a table of times for Taxis (A to H) to reach Customers (1 to...
Below is a table of times for Taxis (A to H) to reach Customers
(1 to 8) who need a ride home after a night on the town. The goal
is to Minimize the time it takes for all of the Taxis to reach
their Customers. Only one Taxi will be sent to each Customer and
each Customer needs only one Taxi.
|
Taxi / Cust |
1 |
2 |
3 |
4 |
5 |
6 |
7 |
8 |
|
A |
18 |
8 |
19 |
14 |
16 |
18 |
7 |
17 |
|
B |
18 |
8 |
19 |
5 |
3 |
6 |
11 |
6 |
|
C |
15 |
4 |
2 |
12 |
3 |
16 |
6 |
2 |
|
D |
13 |
8 |
2 |
12 |
17 |
12 |
5 |
16 |
|
E |
17 |
11 |
15 |
7 |
13 |
13 |
6 |
13 |
|
F |
12 |
8 |
18 |
8 |
17 |
6 |
4 |
11 |
|
G |
12 |
13 |
2 |
8 |
17 |
11 |
16 |
13 |
|
H |
13 |
15 |
18 |
15 |
16 |
15 |
7 |
12 |
The optimal solution to this problem requires the following:
Taxi A picks up Customer
Taxi B picks up Customer
Taxi C picks up Customer
Taxi D picks up Customer
Taxi E picks up Customer
Taxi F picks up Customer
Taxi G picks up Customer
Taxi H picks up Customer
Minimum Cost =
Hint: Your cost should be between 42 and 51
Enter your cost without any Formatting…. No Dollar Signs and No
Commas
Homework Answers


The optimal solution to this problem requires the
following:
Taxi A picks up Customer 2
Taxi B picks up Customer 5
Taxi C picks up Customer 8
Taxi D picks up Customer 7
Taxi E picks up Customer 4
Taxi F picks up Customer 6
Taxi G picks up Customer 3
Taxi H picks up Customer 1
\>> Minimum value = 46
Add Answer to:
Below is a table of times for Taxis (A to H) to reach Customers
(1 to...
Consider an airport where taxis and customers arrive (exponential interarrival times) with respective rates of 1...
Consider an airport where taxis and customers arrive (exponential interarrival times) with respective rates of 1 and 2 per hour. No matter how many other taxis are present, a taxi will wait. If an arriving customer does not find a taxi, the customer immediately leaves. (a) Model this system as a birth-death process (Hint: determine what the state of the system is at any given time and draw a rate diagram.) (b) Find the average number of taxis that are...
Cork price: 16 10 15 10 17 11 14 13 11 14 11 16 18 16...
Cork price: 16 10 15 10 17 11 14 13 11 14 11 16 18 16 10 17 14 14 16 7 10 12 19 15 16 14 9 12 21 13 10 16 12 16 13 17 17 13 14 18 11 12 15 16 13 18 16 17 12 12 14 9 11 14 19 13 11 17 11 13 15 14 18 18 18 12 10 11 13 14 11 14 18 13 13 19 17 14...
Problem 6. The set (Z19 − {0}, ·19) is a group with the indicated operation; see...
 Problem 6. The set (Z19 − {0}, ·19) is a group with the
indicated operation; see the attached table. a.) Show that H = {1,
7, 8, 11, 12, 18} is a subgroup. b.) List all the right cosets of
H. c.) Show that if Hy = Hx then xy−1 ∈ H. [Make sure to give a
reason for each step.] d.) Show that φ : H → Hx defined by φ(h) =
hx is one-to-one and onto. [Use the...
Problem 6. The set (Z19 − {0}, ·19) is a group with the
indicated operation; see the attached table. a.) Show that H = {1,
7, 8, 11, 12, 18} is a subgroup. b.) List all the right cosets of
H. c.) Show that if Hy = Hx then xy−1 ∈ H. [Make sure to give a
reason for each step.] d.) Show that φ : H → Hx defined by φ(h) =
hx is one-to-one and onto. [Use the...
Complete the table and graph the cumulative relative frequency of heads MR. Harrison tossed a coin 25 times resulting i...
 Complete the table and graph the cumulative relative frequency
of heads
MR. Harrison tossed a coin 25 times resulting in 10 tails. Complete the result in the following table and graph the commulative relatiove frequency of he Commulative relative frequency of H Commulative frequency Toss Number outcome(H or T) 1 2 3 4 5 6 7 8 9 10 11 12 13 14 15 16 17 18 19 20
MR. Harrison tossed a coin 25 times resulting in 10 tails....
Complete the table and graph the cumulative relative frequency
of heads
MR. Harrison tossed a coin 25 times resulting in 10 tails. Complete the result in the following table and graph the commulative relatiove frequency of he Commulative relative frequency of H Commulative frequency Toss Number outcome(H or T) 1 2 3 4 5 6 7 8 9 10 11 12 13 14 15 16 17 18 19 20
MR. Harrison tossed a coin 25 times resulting in 10 tails....
Suppose there are 100 identical firms in the market and the luggage industry is perfectly competitive....
 Suppose there are 100 identical firms in the market and the luggage industry is perfectly competitive. What does the market supply curve look like? 20 19 18 17 16 15 14 13 12 11 A 10 9 8 7 6 5 4 20 19 18 17 16 15 14 13 12 11 A 10 8 7 6 2 1 0 0 0 1 2 3 4 5 6 7 8 9 10 11 12 0 1 2 3 4 5...
1 question is this choose mcq quickly 10 p The following data represent the total number...
 1 question is this choose mcq quickly
10 p The following data represent the total number of years of formal education for 40 employees of a bank. 13 17 13 14 12 17 19 13 15 13 16 18 13 11 19 19 14 15 13 15 17 18 17 14 13 17 12 17 17 16 16 17 15 13 13 14 12 14 1313 Construct a frequency distribution for the number of years of education. Number of years...
1 question is this choose mcq quickly
10 p The following data represent the total number of years of formal education for 40 employees of a bank. 13 17 13 14 12 17 19 13 15 13 16 18 13 11 19 19 14 15 13 15 17 18 17 14 13 17 12 17 17 16 16 17 15 13 13 14 12 14 1313 Construct a frequency distribution for the number of years of education. Number of years...
Customer Service. A customer service department asks its customers to rate their over-the-phone service on a...
Customer Service. A customer service department asks its customers to rate their over-the-phone service on a scale of 1-20 immediately after their service has been completed. The department then matches each customer’s rating with the number of minutes the person waited on hold. The file “Hold” on d2l contains data for the ratings and number of minutes on hold for 20 customers. As demonstrated in the lecture, please create a subset data of size 16 and perform your statistical analysis...
Review the 6 karyotypes in Figure 10 and determine the chromosomal disorder. Record the chromosomal disorder...
 Review the 6 karyotypes in Figure 10 and determine the
chromosomal disorder. Record the chromosomal disorder in
Data Table 3.
Describe the genotype of each chromosomal disorder and record
in Data Table 3.
Describe the phenotype of each chromosomal disorder and record
in Data Table 3.
Data Table 3: Karyotype to Genotype to Phenotype
#
Chromosomal Disorder
Genotype
Phenotype
1
2
3
4
5
6
1 2 3 4 5 6 7 8 1 2 3 4 5 6 7...
Review the 6 karyotypes in Figure 10 and determine the
chromosomal disorder. Record the chromosomal disorder in
Data Table 3.
Describe the genotype of each chromosomal disorder and record
in Data Table 3.
Describe the phenotype of each chromosomal disorder and record
in Data Table 3.
Data Table 3: Karyotype to Genotype to Phenotype
#
Chromosomal Disorder
Genotype
Phenotype
1
2
3
4
5
6
1 2 3 4 5 6 7 8 1 2 3 4 5 6 7...
j. Create a Conditional Probabilities Pivot Table (% of column) for ‘Gender’ and ‘Prefer Scent’, to know the probability...
j. Create a Conditional Probabilities Pivot Table (% of column) for ‘Gender’ and ‘Prefer Scent’, to know the probability that a customer will be of a certain gender given Yes or No preference for the scent. (For example, that if a customer comes into the store because they prefer the scent, what is the probability that the customer will be a female). Create another Conditional Probabilities Table (% of row) for ‘Gender’ and ‘Prefer Scent’, to know the probability that...
 Problem 6. The set (Z19 − {0}, ·19) is a group with the
indicated operation; see the attached table. a.) Show that H = {1,
7, 8, 11, 12, 18} is a subgroup. b.) List all the right cosets of
H. c.) Show that if Hy = Hx then xy−1 ∈ H. [Make sure to give a
reason for each step.] d.) Show that φ : H → Hx defined by φ(h) =
hx is one-to-one and onto. [Use the...
Problem 6. The set (Z19 − {0}, ·19) is a group with the
indicated operation; see the attached table. a.) Show that H = {1,
7, 8, 11, 12, 18} is a subgroup. b.) List all the right cosets of
H. c.) Show that if Hy = Hx then xy−1 ∈ H. [Make sure to give a
reason for each step.] d.) Show that φ : H → Hx defined by φ(h) =
hx is one-to-one and onto. [Use the...
 Complete the table and graph the cumulative relative frequency
of heads
MR. Harrison tossed a coin 25 times resulting in 10 tails. Complete the result in the following table and graph the commulative relatiove frequency of he Commulative relative frequency of H Commulative frequency Toss Number outcome(H or T) 1 2 3 4 5 6 7 8 9 10 11 12 13 14 15 16 17 18 19 20
MR. Harrison tossed a coin 25 times resulting in 10 tails....
Complete the table and graph the cumulative relative frequency
of heads
MR. Harrison tossed a coin 25 times resulting in 10 tails. Complete the result in the following table and graph the commulative relatiove frequency of he Commulative relative frequency of H Commulative frequency Toss Number outcome(H or T) 1 2 3 4 5 6 7 8 9 10 11 12 13 14 15 16 17 18 19 20
MR. Harrison tossed a coin 25 times resulting in 10 tails....
 Suppose there are 100 identical firms in the market and the luggage industry is perfectly competitive. What does the market supply curve look like? 20 19 18 17 16 15 14 13 12 11 A 10 9 8 7 6 5 4 20 19 18 17 16 15 14 13 12 11 A 10 8 7 6 2 1 0 0 0 1 2 3 4 5 6 7 8 9 10 11 12 0 1 2 3 4 5...
 1 question is this choose mcq quickly
10 p The following data represent the total number of years of formal education for 40 employees of a bank. 13 17 13 14 12 17 19 13 15 13 16 18 13 11 19 19 14 15 13 15 17 18 17 14 13 17 12 17 17 16 16 17 15 13 13 14 12 14 1313 Construct a frequency distribution for the number of years of education. Number of years...
1 question is this choose mcq quickly
10 p The following data represent the total number of years of formal education for 40 employees of a bank. 13 17 13 14 12 17 19 13 15 13 16 18 13 11 19 19 14 15 13 15 17 18 17 14 13 17 12 17 17 16 16 17 15 13 13 14 12 14 1313 Construct a frequency distribution for the number of years of education. Number of years...
 Review the 6 karyotypes in Figure 10 and determine the
chromosomal disorder. Record the chromosomal disorder in
Data Table 3.
Describe the genotype of each chromosomal disorder and record
in Data Table 3.
Describe the phenotype of each chromosomal disorder and record
in Data Table 3.
Data Table 3: Karyotype to Genotype to Phenotype
#
Chromosomal Disorder
Genotype
Phenotype
1
2
3
4
5
6
1 2 3 4 5 6 7 8 1 2 3 4 5 6 7...
Review the 6 karyotypes in Figure 10 and determine the
chromosomal disorder. Record the chromosomal disorder in
Data Table 3.
Describe the genotype of each chromosomal disorder and record
in Data Table 3.
Describe the phenotype of each chromosomal disorder and record
in Data Table 3.
Data Table 3: Karyotype to Genotype to Phenotype
#
Chromosomal Disorder
Genotype
Phenotype
1
2
3
4
5
6
1 2 3 4 5 6 7 8 1 2 3 4 5 6 7...
Most questions answered within 3 hours.
-
Which of the following pairs of ions have the same electron
configuration?
I: Br− and Se2−...
asked 28 minutes ago -
The Foremost Composite Materials Company is planning a two-day
sales conference for October 19-20. The conference...
asked 50 minutes ago -
3) Illustrate the observed pattern of relatedness of organisms
versus adaptations to specific conditions. This means...
asked 1 hour ago -
In winter a lake has a 0.35 m thick ice layer over 1.10 m of
water....
asked 2 hours ago -
Assuming the following has been encrypted with a Vigenere cipher
below, use the method(s) and assumptions...
asked 2 hours ago -
How would I use switch statements to write a program that will
take an input of...
asked 2 hours ago -
Imagine a reaction in which methane gas combusts at a constant
pressure of 1 atm and...
asked 2 hours ago -
Two parallel wires (each 12 m in length) are separated by a
distance of 0.065 m...
asked 2 hours ago -
Suppose there were three masses at the corner of uniform
equilateral triangle. The masses are m1...
asked 2 hours ago -
Situation: A building that is 618 m above the ground floor. How
many times would a...
asked 2 hours ago -
help me and discuss one successful and one
unsuccessful international company/busines in Indonesia.whyit
succeed and why...
asked 2 hours ago -
I- Choose the best answer
Which of the following statements about the structure and
packaging of...
asked 2 hours ago