For this question, you are to use a graph to illustrate the change(s) and then explain...
For this question, you are to use a graph to illustrate the change(s) and then explain the situation in one or two sentences. You may have to go back to earlier material to find some of the answers. You may assume that the economy is in a long-run macroeconomic equilibrium at the beginning of each part.
- Draw the aggregate demand and aggregate supply model.
Illustrate long-run macroeconomic equilibrium. (2.0
marks)
- There is a decrease in the money wages paid to the workers, as
unionization declines across the nation. How will the aggregate
supply curve(s) change? (1 mark) What is the
outcome in the short-run? (2 marks)
- There is a decrease in exports due to trade disputes. Show the new short-run equilibrium and describe the process. (5 marks)
Homework Answers
A.
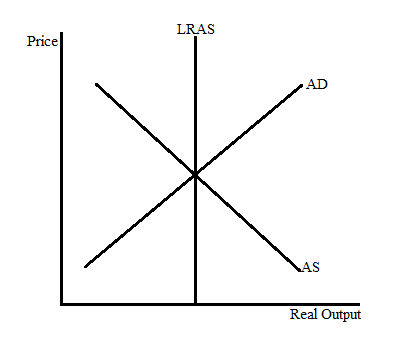
Economy is at a long run equilibrium. Real output is at the potential level of output.
B

Lower money wage paid to the workers, reduces the cost of production. It cause AS to increase and shifts to the right. It decreases the price level as well in the short run.
C.

Due to decrease in export, net export of the GDP decreases. It causes AD to decrease and it shifts to the left.
Add Answer to:
For this question, you are to use a graph to illustrate the
change(s) and then explain...
Check And < Question 11 of 13 > The graphs below illustrate an initial equilibrium for...
 Check And < Question 11 of 13 > The graphs below illustrate an initial equilibrium for the economy. Suppose that investment spending falls. Use the graphs to show the new positions of aggregate demand (AD), short-run aggregate supply (SRAS), and long-run aggregate supply (LRAS) in both the short-run and the long-run, as well as the short-run and long-run equilibria resulting from this change. Then answer what happens to the price level and GDP. Short-run graph SRAS Short-run equilibrium Aggregate price...
graph requires adjustment Question 8 of 16 > The accompanying graphs illustrate an initial equilibrium for...
 graph requires adjustment
Question 8 of 16 > The accompanying graphs illustrate an initial equilibrium for the economy. Suppose that a snowstorm destroys a large number of corn crops. Use the graphs to show the new positions of aggregate demand (AD), short-run aggregate supply (SRAS), and long-run aggregate supply (LRAS) in both the short-run and the long-run, as well as the short-run (Esr) and long-run (Eur) equilibria resulting from this change. Then answer what happens to the price level and...
graph requires adjustment
Question 8 of 16 > The accompanying graphs illustrate an initial equilibrium for the economy. Suppose that a snowstorm destroys a large number of corn crops. Use the graphs to show the new positions of aggregate demand (AD), short-run aggregate supply (SRAS), and long-run aggregate supply (LRAS) in both the short-run and the long-run, as well as the short-run (Esr) and long-run (Eur) equilibria resulting from this change. Then answer what happens to the price level and...
The graphs illustrate an initial equilibrium for the economy. Suppose that oil prices temporarily decrease Use...
 The graphs illustrate an initial equilibrium for the economy. Suppose that oil prices temporarily decrease Use the graphs to show the new positions of aggregate demand (AD), short-run aggregate supply (SRAS), and long-run aggregate supply (LRAS) in both the short run and the long run, as well as the short-run and long-run equilibriums resulting from this change. Then, indicate what happens to the price level and GDP in the short run and in the long run. Short-run graph Long-run graph...
Keynesian Analyses Graph: You may use your preferred drawing tool such as Paint, Word, PowerPoint or...
Keynesian Analyses Graph: You may use your preferred drawing tool such as Paint, Word, PowerPoint or you can use pencil and paper for this assignment. You are to illustrate/graph long run aggregate supply curve, short run aggregate supply curve and aggregate demand curve in equilibrium. The equilibrium price level is $110 and equilibrium output level is 12 trillion. Show a shift of the curve that leads to an inflationary gap. Label the new curve and label the inflationary gap. Capture...
The graphs illustrate an initial equilibrium for the economy. Suppose that the stock market broadly decreases....
 The graphs illustrate an initial equilibrium for the economy. Suppose that the stock market broadly decreases. Use the graphs to show the new positions of aggregate demand (AD), short-run aggregate supply (SRAS), and long-run aggregate supply (LRAS) in both the short run and the long run, as well as the short-run and long-run equilibriums resulting from this change. Then, indicate what happens to the price level and GDP in the short run and in the long run. Short-run graph Long-run...
11. Using aggregate demand, short-run aggregate sup- ply, and long-run aggregate supply curves, explain the process...
 11. Using aggregate demand, short-run aggregate sup- ply, and long-run aggregate supply curves, explain the process by which each of the following economic - TEMO alderen events will move the economy from one l. macroeconomic equilibrium to another mu with diagrams. In each case, what are the and long-run effects on the aggregate price lev aggregate output? m one long-run other. Illustrate are the short-run te price level and a. There is a decrease in households' wealth due to decline...
Suppose that the economy is at long-run equilibrium. a. Draw a diagram to illustrate the state of the economy. Be su...
 Suppose that the economy is at long-run equilibrium. a. Draw a diagram to illustrate the state of the economy. Be sure to show aggregate demand, short-run aggregate supply, and long-run aggregate supply. b. Now suppose that a severe decline in the value of homes has affected the entire economy. Use your diagram to show what happens to output, employment, and the price level in the short run. Explain how households and businesses will adjust to this unanticipated shock to the...
Beginning with long-run equilibrium, use the aggregate demand and aggregate supply model to illustrate what happens...
Beginning with long-run equilibrium, use the aggregate demand and aggregate supply model to illustrate what happens in the short run when the economy suffers a negative supply shock. (10 points)
5) If consumption increases by $200 and, in response, equilibrium aggregate expenditure increases by $600, the...
 5) If consumption increases by $200 and, in response, equilibrium aggregate expenditure increases by $600, the multiplier is A) 5 B) 0.5.C)2. D) 0.3. 6) When the GDP in Kuwait rises relative to the GDP in other countries, will fall and will fall A) exports; imports B) exports; net exports C) imports; net exports D) net exports; imports 7) An increase in the price level will A) shift the aggregate demand curve to the left. B) shift the aggregate demand...
• draw an aggregate demand and aggregate supply diagram to illustrate your answer • show the...
• draw an aggregate demand and aggregate supply diagram to illustrate your answer • show the change in aggregate demand and/or aggregate supply • describe the change(s) you have shown • explain why the adjustments you have described occur. 1. Suppose that there is an expansion of private consumption due to increased optimism about future growth prospects for the economy. (i) Illustrate and explain the effect of this shock in the short-run. (ii) What is the long-run effect likely to...
 Check And < Question 11 of 13 > The graphs below illustrate an initial equilibrium for the economy. Suppose that investment spending falls. Use the graphs to show the new positions of aggregate demand (AD), short-run aggregate supply (SRAS), and long-run aggregate supply (LRAS) in both the short-run and the long-run, as well as the short-run and long-run equilibria resulting from this change. Then answer what happens to the price level and GDP. Short-run graph SRAS Short-run equilibrium Aggregate price...
 graph requires adjustment
Question 8 of 16 > The accompanying graphs illustrate an initial equilibrium for the economy. Suppose that a snowstorm destroys a large number of corn crops. Use the graphs to show the new positions of aggregate demand (AD), short-run aggregate supply (SRAS), and long-run aggregate supply (LRAS) in both the short-run and the long-run, as well as the short-run (Esr) and long-run (Eur) equilibria resulting from this change. Then answer what happens to the price level and...
graph requires adjustment
Question 8 of 16 > The accompanying graphs illustrate an initial equilibrium for the economy. Suppose that a snowstorm destroys a large number of corn crops. Use the graphs to show the new positions of aggregate demand (AD), short-run aggregate supply (SRAS), and long-run aggregate supply (LRAS) in both the short-run and the long-run, as well as the short-run (Esr) and long-run (Eur) equilibria resulting from this change. Then answer what happens to the price level and...
 The graphs illustrate an initial equilibrium for the economy. Suppose that oil prices temporarily decrease Use the graphs to show the new positions of aggregate demand (AD), short-run aggregate supply (SRAS), and long-run aggregate supply (LRAS) in both the short run and the long run, as well as the short-run and long-run equilibriums resulting from this change. Then, indicate what happens to the price level and GDP in the short run and in the long run. Short-run graph Long-run graph...
 The graphs illustrate an initial equilibrium for the economy. Suppose that the stock market broadly decreases. Use the graphs to show the new positions of aggregate demand (AD), short-run aggregate supply (SRAS), and long-run aggregate supply (LRAS) in both the short run and the long run, as well as the short-run and long-run equilibriums resulting from this change. Then, indicate what happens to the price level and GDP in the short run and in the long run. Short-run graph Long-run...
 11. Using aggregate demand, short-run aggregate sup- ply, and long-run aggregate supply curves, explain the process by which each of the following economic - TEMO alderen events will move the economy from one l. macroeconomic equilibrium to another mu with diagrams. In each case, what are the and long-run effects on the aggregate price lev aggregate output? m one long-run other. Illustrate are the short-run te price level and a. There is a decrease in households' wealth due to decline...
 Suppose that the economy is at long-run equilibrium. a. Draw a diagram to illustrate the state of the economy. Be sure to show aggregate demand, short-run aggregate supply, and long-run aggregate supply. b. Now suppose that a severe decline in the value of homes has affected the entire economy. Use your diagram to show what happens to output, employment, and the price level in the short run. Explain how households and businesses will adjust to this unanticipated shock to the...
 5) If consumption increases by $200 and, in response, equilibrium aggregate expenditure increases by $600, the multiplier is A) 5 B) 0.5.C)2. D) 0.3. 6) When the GDP in Kuwait rises relative to the GDP in other countries, will fall and will fall A) exports; imports B) exports; net exports C) imports; net exports D) net exports; imports 7) An increase in the price level will A) shift the aggregate demand curve to the left. B) shift the aggregate demand...
Most questions answered within 3 hours.
-
The manager at a car assembly plant believes that the mean
assembly time for a car...
asked 11 minutes ago -
Which of the following is true of electron capture?
A) It decreases the nuclide's mass number...
asked 1 hour ago -
Assuming an efficiency of 43.10%, calculate the actual yield of
magnesium nitrate formed from 114.9 g...
asked 2 hours ago -
The highly pathogenic bacterium Clostridium
perfringens causes gangrene, a disease that results in the
destruction of...
asked 4 hours ago -
In the context of situation analysis, which of the following is
a category for analysis in...
asked 4 hours ago -
In a study of the gas phase decomposition of sulfuryl chloride
at 600 K SO2Cl2(g)SO2(g) +...
asked 4 hours ago -
75 g of 2-propanol (C3H8O) and 25 g of pentane are mixed in a
200 mL...
asked 4 hours ago -
The 2800-turn coil in a dc motor has an area per turn of 1.1 ×
10-2...
asked 4 hours ago -
Draw a combinational logic circuit diagram with a symbol inside
the box for two I/P of...
asked 4 hours ago -
The cliché we use quite a lot in finance is: there is a need to
maximize...
asked 4 hours ago -
In class we discussed the addition of HCl to alpha pinene. Would
you expect one or...
asked 4 hours ago -
I'm trying to explain to my daughter to help her please help
me
I tagged the...
asked 4 hours ago