Wal-Mart is the second-largest retailer in the world. The data file (Wal-Mart Revenue 2004-2009 data.xlsx) is...
Wal-Mart is the second-largest retailer in the world. The data file (Wal-Mart Revenue 2004-2009 data.xlsx) is posted below the case study two file, and it holds monthly data on Wal-Mart’s revenue, along with several possibly related economic variables.
- Develop a multiple linear regression model to predict Wal-Mart's revenue, using CPI, Personal Consumption, and Retail Sales Index as the independent variables. You also need to create residual plots and scatter plots by selecting residual plots box and line fit plots box under “Residuals”. Note: Those plots are for the individual independent variables.
- To generate the residual plot for the entire model, you need to follow the instruction below. Check the Residuals box under “Residuals” and Excel will generate predicted values and residuals at the bottom of the output for the multiple regression model. Then, highlight these two output values to create the residual plot by Excel’s scatter chart (Insert tab > Charts > Scatter chart). Comment on what you see on the plot. Note: This residual plot is for the entire model.
- Does it seem that Wal-Mart’s revenue is closely related to the
general state of the economy? Use all the plots and statistical
criteria on the Regression Analysis output generated by Excel to
explain it.
Identify and delete those five cases (rows) corresponding to December revenue. Then, use the new data set (without the December data) to complete the following problems.
- Develop a multiple linear regression model to predict Wal-Mart's revenue, using CPI, Personal Consumption, and Retail Sales Index as the independent variables. You also need to create residual plots and scatter plots by selecting residual plots box and line fit plots box under “Residuals”. Note: Those plots are for the individual independent variables.
- Check the Residuals box under “Residuals” and Excel will generate predicted values and residuals at the bottom of the output for the multiple regression model. Then, highlight these two output values to create the residual plot by Excel’s scatter chart (Insert tab > Charts > Scatter chart). Comment on what you see on the plot. Note: This residual plot is for the entire model.
- Does it seem that Wal-Mart’s revenue is closely related to the general state of the economy? Use all the plots and statistical criteria on the Regression Analysis output generated by Excel to explain it.
- Compare these two multiple regression models, and decide which of these two models is better? Use R-square values, adjusted R-square values, Significance F values, p-values, scatter plots and residual plots to explain your answer.
Date Wal Mart Revenue CPI Personal Consumption Retail Sales Index December
1/30/04 12.031 561.9 7983730 279463 0
2/27/04 13.988 547.9 8105878 273645 0
3/31/04 16.322 561.5 8090480 335107 0
4/29/04 13.98 564.2 8086579 315278 0
5/28/04 14.388 566.4 8196516 328499 0
6/30/04 18.111 558.2 8161271 321151 0
7/27/04 13.764 567.5 8235349 322025 0
8/27/04 14.696 567.6 8246121 326280 0
9/30/04 16.569 568.7 8323670 310444 0
10/29/04 13.915 571.9 8371605 319639 0
11/29/04 15.739 572.2 8410820 324067 0
12/31/04 26.177 570.1 8562026 389718 1
1/21/05 13.17 579.2 8469443 293027 0
2/24/05 15.139 574.5 8520687 294892 0
3/30/05 18.683 579 8568959 338969 0
4/29/05 14.829 582.9 8654352 335626 0
5/25/05 15.697 582.4 8644646 345400 0
6/28/05 19.23 582.6 8924753 351068 0
7/28/05 16.96 580.2 8833907 361887 0
8/26/05 15.709 588.2 8825450 355897 0
9/30/05 19.918 585.4 8882536 333652 0
10/31/05 15.397 596.7 8911627 336662 0
11/28/05 17.384 592 8916377 344441 0
12/30/05 27.92 584.4 8955472 406510 1
1/27/06 14.555 593.9 9034368 320222 0
2/23/06 18.684 595.2 9079246 318184 0
3/31/06 17.639 598.6 9123848 366989 0
4/28/06 20.17 603.5 9175181 357334 0
5/25/06 16.901 606.5 9238576 380085 0
6/30/06 21.47 607.8 9270505 373279 0
7/28/06 16.042 609.6 9338876 368611 0
8/29/06 16.98 610.9 9352650 382600 0
9/28/06 18.091 607.9 9368494 352686 0
10/20/06 16.583 604.6 9376027 334740 0
11/24/06 18.761 603.6 9310758 363468 0
12/29/06 28.795 609.5 9478531 424946 1
1/26/07 20.473 606.27 9540335 332797 0
2/23/07 20.984 611.2 9539246 327686 0
3/30/07 18.939 614.9 9583848 376491 0
4/27/07 21.47 619.8 9635181 366936 0
5/25/07 19.201 622.8 9698576 389687 0
6/29/07 23.77 623.9 9731285 382781 0
7/27/07 18.942 625.6 9799656 378113 0
8/31/07 19.38 626.9 9813630 392125 0
9/28/07 21.491 623.9 9809274 362211 0
10/26/07 18.983 621.6 9836807 364265 0
11/30/07 21.161 620.6 9870758 372970 0
12/28/07 31.845 622.5 9946331 434488 1
1/25/08 22.923 623.35 10008141 342422 0
2/29/08 21.512 622.28 10032148 344464 0
3/28/08 22.023 626.9 10030959 339463 0
4/25/08 20.018 631.2 10175561 388158 0
5/30/08 23.509 636.1 10126994 368653 0
6/27/08 21.24 638.7 10090289 431354 0
7/25/08 24.809 640.2 10223995 394488 0
8/29/08 20.981 641.9 10291369 389780 0
9/26/08 20.419 643.2 10305343 403812 0
10/31/08 23.53 641.2 10301087 373978 0
11/28/08 21.022 637.9 10328520 375932 0
12/26/08 23.2 636.9 10362495 384677 1
1/30/09 28.184 641.8 10438041 446195 0
2/27/09 23.962 639.65 10499948 353997 0
3/27/09 22.951 638.93 10523764 356183 0
4/24/09 24.062 643.7 10522721 351032 0
5/29/09 26.592 646.1 10546927 348650 0
6/26/09 23.29 647.5 10591006 461356 0
7/31/09 28.809 657.2 10723995 404488 0
8/28/09 27.981 659.9 10791369 409780 0
Homework Answers
| R² | 0.716 | |||||
| Adjusted R² | 0.703 | |||||
| R | 0.846 | |||||
| Std. Error | 2.406 | |||||
| n | 68 | |||||
| k | 3 | |||||
| Dep. Var. | Revenue | |||||
| ANOVA table | ||||||
| Source | SS | df | MS | F | p-value | |
| Regression | 935.1778 | 3 | 311.7259 | 53.85 | 1.72E-17 | |
| Residual | 370.5055 | 64 | 5.7891 | |||
| Total | 1,305.6833 | 67 | ||||
| Regression output | confidence interval | |||||
| variables | coefficients | std. error | t (df=64) | p-value | 95% lower | 95% upper |
| Intercept | 58.6340 | |||||
| CPI | -0.2915 | 0.0693 | -4.206 | .0001 | -0.4299 | -0.1531 |
| Personal Consumption | 0.00001247 | 0.00000243 | 5.136 | 2.84E-06 | 0.00000762 | 0.00001732 |
| Retail Sales Index | 0.00005849 | 0.00001080 | 5.415 | 9.83E-07 | 0.00003691 | 0.00008006 |
The multiple linear regression model to predict Wal-Mart's revenue, using CPI, Personal Consumption, and Retail Sales Index as the independent variables is:
Revenue = 58.6340 - 0.2915*CPI + 0.00001247*Personal Consumption + 0.00005849*Retail Sales Index
The residual plots are:


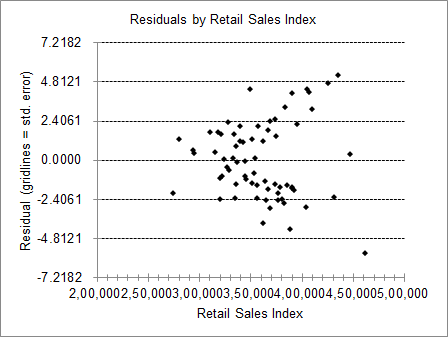
Wal-Mart’s revenue is closely related to the general state of the economy.
Please give me a thumbs-up if this helps you out. Thank you!
Add Answer to:
Wal-Mart is the second-largest retailer in the world. The data
file (Wal-Mart Revenue 2004-2009 data.xlsx) is...
Need help writing a program that meets pseudocode and criteria . Txt File below input.txt file...
 Need help writing a program that meets pseudocode and criteria .
Txt File below
input.txt file data
05 11/30/16
03 12/07/16
05 12/07/16
05 12/08/16
01 12/10/16
07 12/11/16
07 12/14/16
06 12/15/16
02 12/21/16
05 12/21/16
06 12/22/16
07 12/22/16
08 12/23/16
07 12/23/16
07 12/23/16
07 12/23/16
08 12/24/16
08 12/24/16
07 12/24/16
03 12/26/16
05 12/26/16
07 12/28/16
04 12/29/16
07 01/01/17
06 01/03/17
07 01/03/17
08 01/05/17
05 01/10/17
04 01/17/17
08 01/17/17
07 01/18/17
07...
Need help writing a program that meets pseudocode and criteria .
Txt File below
input.txt file data
05 11/30/16
03 12/07/16
05 12/07/16
05 12/08/16
01 12/10/16
07 12/11/16
07 12/14/16
06 12/15/16
02 12/21/16
05 12/21/16
06 12/22/16
07 12/22/16
08 12/23/16
07 12/23/16
07 12/23/16
07 12/23/16
08 12/24/16
08 12/24/16
07 12/24/16
03 12/26/16
05 12/26/16
07 12/28/16
04 12/29/16
07 01/01/17
06 01/03/17
07 01/03/17
08 01/05/17
05 01/10/17
04 01/17/17
08 01/17/17
07 01/18/17
07...
The below image shows diagnostic plots for a linear regression analysis. Decide if these plots represent...
 The below image shows diagnostic plots for a linear regression analysis. Decide if these plots represent a significant departure from the assumptions of linear regression. If they do then select the most severe violation of the assumptions revealed by the diagnostics. Normality check QQ Plot Residual Plot 3 2 101 2 3 02 04 05 08 10 Theoretical Guantiles Histogram for the Residuals Model Fit R"2# 096 0.4 0.2 00 02 04 00 02 04 06 08 10 Residual Value...
Score: 0 or 3 pts 9.2.33 Use the data in the table below to complete parts...
 Score: 0 or 3 pts 9.2.33 Use the data in the table below to complete parts (a) through (d) 11 of 15 (10 complete) 34 20 40 23 Click the icon to view details on how to construct and interpret residual plots. 43 26 59 28 53 26 21 29 28 23 뮬 (a) Find the equation of the regression line. Steps for Constructing a Residual Plot (Round to three decimal places as needed.) To construct a residual plot, make...
The file containing the JAVA files, pseudocode file and doc file that have written for this...
 The file containing the JAVA files, pseudocode file and doc file
that have written for this lab.
Preamble The file releasedates.txt contains a list of video games and their release dates. Each line of the file contains the release date, a tab character, and then the name. The list is currently totally unsorted. The object of today's lab is to write a series of methods that allow us to perform the following tasks: read contents from a file and store...
The file containing the JAVA files, pseudocode file and doc file
that have written for this lab.
Preamble The file releasedates.txt contains a list of video games and their release dates. Each line of the file contains the release date, a tab character, and then the name. The list is currently totally unsorted. The object of today's lab is to write a series of methods that allow us to perform the following tasks: read contents from a file and store...
Need help with C++ assignment Assignment 1 and .txt files are provided at the bottom. PART...
 Need help with C++ assignment
Assignment 1 and .txt files are provided at the
bottom.
PART A
PART B
Assignment
1
#include <iostream>
#include <string>
#include <fstream>
#include <iomanip>
#include <stdio.h>
#include <ctype.h>
#include <string.h>
#include <algorithm>
using namespace std;
/**
This structure is to store the date and it has three integer
fields
**/
struct Date{
int day;
int month;
int year;
};
/**
This structure is to store the size of the box and it...
Need help with C++ assignment
Assignment 1 and .txt files are provided at the
bottom.
PART A
PART B
Assignment
1
#include <iostream>
#include <string>
#include <fstream>
#include <iomanip>
#include <stdio.h>
#include <ctype.h>
#include <string.h>
#include <algorithm>
using namespace std;
/**
This structure is to store the date and it has three integer
fields
**/
struct Date{
int day;
int month;
int year;
};
/**
This structure is to store the size of the box and it...
2.-Interpret the following regression model Call: lm(formula = Sale.Price ~ Lot.Size + Square.Feet + Num.Baths + API.2011 + dis_coast + I(dis_fwy * dis_down * dis_coast) + Pool, data = Train...
2.-Interpret the following regression model Call: lm(formula = Sale.Price ~ Lot.Size + Square.Feet + Num.Baths + API.2011 + dis_coast + I(dis_fwy * dis_down * dis_coast) + Pool, data = Training) Residuals: Min 1Q Median 3Q Max -920838 -84637 -19943 68311 745239 Coefficients: Estimate Std. Error t value Pr(>|t|) (Intercept) -7.375e+05 7.138e+04 -10.332 < 2e-16 *** Lot.Size -5.217e-01 1.139e-01 -4.581 5.34e-06 *** Square.Feet 1.124e+02 1.086e+01 10.349 < 2e-16 *** Num.Baths 3.063e+04 9.635e+03 3.179 0.00153 ** API.2011 1.246e+03 8.650e+01 14.405 < 2e-16...
Code with Java using arrays and Scanner only ( input should end with 0 to terminate...
Code with Java using arrays and Scanner only ( input should end with 0 to terminate the program) Everyone loves to be celebrated on their birthdays. Birthday celebration can encourage positive social interaction among co-workers, foster friendship among classmates or even strengthen bond between families. Birthday graph can be display in many forms. It can a creative drawing consists of cupcakes, balloons, candles with names, or it can be in the form of simple bar chart to indicate the birthday...
Java code BIRTHDAY GRAPH5 4B Input Standard input Output Standard output Topic Array & Array Processing...
 Java code
BIRTHDAY GRAPH5 4B Input Standard input Output Standard output Topic Array & Array Processing Birthday Graph Problem Description Everyone loves to be celebrated on their birthdays. Birthday celebration can encourage positive social E interaction among co-workers, foster friendship among classmates or even strengthen bond between E BOBO Birthday graph can be display in many forms. It can a creative drawing consists of cupcakes, balloons, UU candles with names, or it can be in the form of simple bar...
Java code
BIRTHDAY GRAPH5 4B Input Standard input Output Standard output Topic Array & Array Processing Birthday Graph Problem Description Everyone loves to be celebrated on their birthdays. Birthday celebration can encourage positive social E interaction among co-workers, foster friendship among classmates or even strengthen bond between E BOBO Birthday graph can be display in many forms. It can a creative drawing consists of cupcakes, balloons, UU candles with names, or it can be in the form of simple bar...
. The data set below contains information about the gasoline mileage performance for 32 au- tomob...
 please answer the following using the r code provided
. The data set below contains information about the gasoline mileage performance for 32 au- tomobiles. We are interested in developing a model to predict the miles per gallon () using related predictor variables. The variables in the study are Dependent variable: Miles per gallon (v) Independent variables: ri horsepower (ft-lb) ra: torque (ft-lb) r: horsepower+torque (ft-lb) rs: carburetor (barrels) (a) We first start by fitting a model using y and...
please answer the following using the r code provided
. The data set below contains information about the gasoline mileage performance for 32 au- tomobiles. We are interested in developing a model to predict the miles per gallon () using related predictor variables. The variables in the study are Dependent variable: Miles per gallon (v) Independent variables: ri horsepower (ft-lb) ra: torque (ft-lb) r: horsepower+torque (ft-lb) rs: carburetor (barrels) (a) We first start by fitting a model using y and...
Please explain the steps that need to be taken in Excel in order to complete the questions.
 Please explain the steps that need to be taken in Excel in order
to complete the questions.
Wal-Mart Revenue: Case Study One Wal-Mart is the second largest retailer in the world. The data file (WalMart_revenue.xlsx) is included in the Excel data zip file in week one, and it holds monthly data on Wal-Mart's revenue, along with several possibly related economic variables. (a) Develop a linear regression model to predict Wal-Mart revenue, using CPI as the only (b) Develop a linear...
Please explain the steps that need to be taken in Excel in order
to complete the questions.
Wal-Mart Revenue: Case Study One Wal-Mart is the second largest retailer in the world. The data file (WalMart_revenue.xlsx) is included in the Excel data zip file in week one, and it holds monthly data on Wal-Mart's revenue, along with several possibly related economic variables. (a) Develop a linear regression model to predict Wal-Mart revenue, using CPI as the only (b) Develop a linear...
 Need help writing a program that meets pseudocode and criteria .
Txt File below
input.txt file data
05 11/30/16
03 12/07/16
05 12/07/16
05 12/08/16
01 12/10/16
07 12/11/16
07 12/14/16
06 12/15/16
02 12/21/16
05 12/21/16
06 12/22/16
07 12/22/16
08 12/23/16
07 12/23/16
07 12/23/16
07 12/23/16
08 12/24/16
08 12/24/16
07 12/24/16
03 12/26/16
05 12/26/16
07 12/28/16
04 12/29/16
07 01/01/17
06 01/03/17
07 01/03/17
08 01/05/17
05 01/10/17
04 01/17/17
08 01/17/17
07 01/18/17
07...
Need help writing a program that meets pseudocode and criteria .
Txt File below
input.txt file data
05 11/30/16
03 12/07/16
05 12/07/16
05 12/08/16
01 12/10/16
07 12/11/16
07 12/14/16
06 12/15/16
02 12/21/16
05 12/21/16
06 12/22/16
07 12/22/16
08 12/23/16
07 12/23/16
07 12/23/16
07 12/23/16
08 12/24/16
08 12/24/16
07 12/24/16
03 12/26/16
05 12/26/16
07 12/28/16
04 12/29/16
07 01/01/17
06 01/03/17
07 01/03/17
08 01/05/17
05 01/10/17
04 01/17/17
08 01/17/17
07 01/18/17
07...
 The below image shows diagnostic plots for a linear regression analysis. Decide if these plots represent a significant departure from the assumptions of linear regression. If they do then select the most severe violation of the assumptions revealed by the diagnostics. Normality check QQ Plot Residual Plot 3 2 101 2 3 02 04 05 08 10 Theoretical Guantiles Histogram for the Residuals Model Fit R"2# 096 0.4 0.2 00 02 04 00 02 04 06 08 10 Residual Value...
 Score: 0 or 3 pts 9.2.33 Use the data in the table below to complete parts (a) through (d) 11 of 15 (10 complete) 34 20 40 23 Click the icon to view details on how to construct and interpret residual plots. 43 26 59 28 53 26 21 29 28 23 뮬 (a) Find the equation of the regression line. Steps for Constructing a Residual Plot (Round to three decimal places as needed.) To construct a residual plot, make...
 The file containing the JAVA files, pseudocode file and doc file
that have written for this lab.
Preamble The file releasedates.txt contains a list of video games and their release dates. Each line of the file contains the release date, a tab character, and then the name. The list is currently totally unsorted. The object of today's lab is to write a series of methods that allow us to perform the following tasks: read contents from a file and store...
The file containing the JAVA files, pseudocode file and doc file
that have written for this lab.
Preamble The file releasedates.txt contains a list of video games and their release dates. Each line of the file contains the release date, a tab character, and then the name. The list is currently totally unsorted. The object of today's lab is to write a series of methods that allow us to perform the following tasks: read contents from a file and store...
 Need help with C++ assignment
Assignment 1 and .txt files are provided at the
bottom.
PART A
PART B
Assignment
1
#include <iostream>
#include <string>
#include <fstream>
#include <iomanip>
#include <stdio.h>
#include <ctype.h>
#include <string.h>
#include <algorithm>
using namespace std;
/**
This structure is to store the date and it has three integer
fields
**/
struct Date{
int day;
int month;
int year;
};
/**
This structure is to store the size of the box and it...
Need help with C++ assignment
Assignment 1 and .txt files are provided at the
bottom.
PART A
PART B
Assignment
1
#include <iostream>
#include <string>
#include <fstream>
#include <iomanip>
#include <stdio.h>
#include <ctype.h>
#include <string.h>
#include <algorithm>
using namespace std;
/**
This structure is to store the date and it has three integer
fields
**/
struct Date{
int day;
int month;
int year;
};
/**
This structure is to store the size of the box and it...
 Java code
BIRTHDAY GRAPH5 4B Input Standard input Output Standard output Topic Array & Array Processing Birthday Graph Problem Description Everyone loves to be celebrated on their birthdays. Birthday celebration can encourage positive social E interaction among co-workers, foster friendship among classmates or even strengthen bond between E BOBO Birthday graph can be display in many forms. It can a creative drawing consists of cupcakes, balloons, UU candles with names, or it can be in the form of simple bar...
Java code
BIRTHDAY GRAPH5 4B Input Standard input Output Standard output Topic Array & Array Processing Birthday Graph Problem Description Everyone loves to be celebrated on their birthdays. Birthday celebration can encourage positive social E interaction among co-workers, foster friendship among classmates or even strengthen bond between E BOBO Birthday graph can be display in many forms. It can a creative drawing consists of cupcakes, balloons, UU candles with names, or it can be in the form of simple bar...
 please answer the following using the r code provided
. The data set below contains information about the gasoline mileage performance for 32 au- tomobiles. We are interested in developing a model to predict the miles per gallon () using related predictor variables. The variables in the study are Dependent variable: Miles per gallon (v) Independent variables: ri horsepower (ft-lb) ra: torque (ft-lb) r: horsepower+torque (ft-lb) rs: carburetor (barrels) (a) We first start by fitting a model using y and...
please answer the following using the r code provided
. The data set below contains information about the gasoline mileage performance for 32 au- tomobiles. We are interested in developing a model to predict the miles per gallon () using related predictor variables. The variables in the study are Dependent variable: Miles per gallon (v) Independent variables: ri horsepower (ft-lb) ra: torque (ft-lb) r: horsepower+torque (ft-lb) rs: carburetor (barrels) (a) We first start by fitting a model using y and...
 Please explain the steps that need to be taken in Excel in order
to complete the questions.
Wal-Mart Revenue: Case Study One Wal-Mart is the second largest retailer in the world. The data file (WalMart_revenue.xlsx) is included in the Excel data zip file in week one, and it holds monthly data on Wal-Mart's revenue, along with several possibly related economic variables. (a) Develop a linear regression model to predict Wal-Mart revenue, using CPI as the only (b) Develop a linear...
Please explain the steps that need to be taken in Excel in order
to complete the questions.
Wal-Mart Revenue: Case Study One Wal-Mart is the second largest retailer in the world. The data file (WalMart_revenue.xlsx) is included in the Excel data zip file in week one, and it holds monthly data on Wal-Mart's revenue, along with several possibly related economic variables. (a) Develop a linear regression model to predict Wal-Mart revenue, using CPI as the only (b) Develop a linear...
Most questions answered within 3 hours.
-
Calculate the pH of each of the following solutions.
0.50 M HBr
3.1×10⁻⁴ M KOH
4.2×10⁻⁵...
asked 1 hour ago -
For the year ended December 31, Depot Max’s cost of merchandise
sold was $85,600. Inventory at the...
asked 1 hour ago -
Week 10 - Professional Memo Assignment
Professional Memo Assignment
Your mission for this week, should you...
asked 1 hour ago -
Write a Python program that stores the data for each
player on the team, and it...
asked 1 hour ago -
In
the last 3 months, mike never knows when he is going to get his
allowance...
asked 1 hour ago -
Is Ca(OH)2 a Bronsted base, Lewis base, or both? Why?
asked 1 hour ago -
1A- Why don’t voters complain about U.S. tariffs on imported
sugar?
Because sugar is only a...
asked 1 hour ago -
Cash Payback Period
Primera Banco is evaluating two capital investment proposals for
a drive-up ATM kiosk,...
asked 1 hour ago -
Create a button in Swift (Xcode) that will create a charge,
create a charge using Stripe's...
asked 1 hour ago -
The reaction rate of CO and NO2 in the reaction
CO(g) + NO2(g) → CO2(g) +...
asked 1 hour ago -
Imagine that a chemist puts 6.40 mol each of
C3H8 and O2 in a 1.00-L container...
asked 2 hours ago -
How much money should be invested today in order to have $8340
at the end of...
asked 2 hours ago