Data on the fuel consumption ?y of a car at various speeds ?x is given. Fuel...
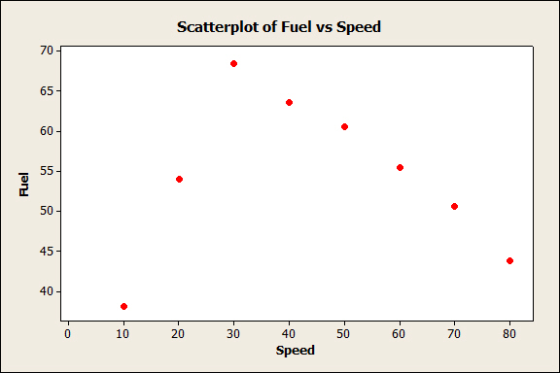
Data on the fuel consumption ?y of a car at various speeds ?x is given. Fuel consumption is measured in mpg, and speed is measured in miles per hour. Software tells us that the equation of the least‑squares regression line is
?̂ =55.3286−0.02286?y^=55.3286−0.02286x
Using this equation, we can add the residuals to the original data.
| Speed | 1010 | 2020 | 3030 | 4040 | 5050 | 6060 | 7070 | 8080 |
|---|---|---|---|---|---|---|---|---|
| Fuel | 38.138.1 | 54.054.0 | 68.468.4 | 63.663.6 | 60.560.5 | 55.455.4 | 50.650.6 | 43.843.8 |
| Residual | −17.00−17.00 | −0.87−0.87 | 13.7613.76 | 9.199.19 | 6.316.31 | 1.441.44 | −3.13−3.13 | −9.70−9.70 |
To access the complete data set, click the link for your preferred software format:
Excel Minitab JMP SPSS TI R Mac-TXT PC-TXT CSV CrunchIt!
(a) Use the software of your choice to make a scatterplot of the observations. Have the software include the regression line on the plot, or print the scatterplot and draw the regression line provided on your plot.
(b) Would you use the regression line to predict ?y from ??x?
No, the pattern is nonlinear, so linear regression is not appropriate for prediction.
No, the pattern is a straight line, so linear regression is not appropriate for prediction.
Yes, the pattern is nonlinear, so linear regression is appropriate for prediction.
Yes, the pattern is a straight line, so linear regression is appropriate for prediction.
(c) On a separate sheet of paper, verify the value of the first residual, for ?=10.x=10. Then verify that the residuals add up to 0.0.
(d) Now use the residuals and ?-valuesx-values in the table to make a plot of the residuals against the values of ?,x, also on a separate sheet of paper. Draw a horizontal line at height 00 on your plot.
Compare your scatter plot with your regression plot. How does the pattern of the residuals about this line compare with the pattern of the data points about the regression line in your original scatterplot?
The observations in the scatter plot that are above the regression line have
and the observations in the scatter plot that are below the regression line have
The distance of the observations above the regression line is
the value of the residual, and the distance of the observations below the regression line is
the absolute value of the residual. Therefore, the pattern of the residuals is
the pattern of the data points about the regression line in the original scatterplot.
Homework Answers
(a)

(b) No, the pattern is nonlinear, so linear regression is not appropriate for prediction.
(c)
The regression equation is
Fuel = 55.329 - 0.023 Speed
Residual for x=10 =(38.1-55.329 - 0.023 *10)=-17.459
(d)
Residuals: -16.999, -0.869, 13.761, 9.191, 6.321, 1.451, -3.119, -9.689

The distance of the observations above the regression line is the value of the residual, and the distance of the observations below the regression line is the absolute value of the residual. Therefore, the pattern of the residuals is the pattern of the data points about the regression line in the original scatter plot.
Add Answer to:
Data on the fuel consumption ?y of a car at various speeds ?x is
given. Fuel...
The following data represent the time between eruptions and the length of eruption for 8 randomly...
 The following data represent the time between eruptions and the length of eruption for 8 randomly selected geyser eruptions. Complete parts (a) through (c) below. Click here to view a scatter plot of the data. Click here to view a residual plot of the data. Time, x 12.15 11.62 11.96 12.19 11.29 Length, y 1.86 1.74 1.81 1.93 1.67 Time, x 11.68 12.13 11.59 11.68 Length, y 1.78 1.85 1.75 1.71 (a) What type of relation appears to exist between...
How does the fuel consumption of a car change as its speed increases? The table contains...
How does the fuel consumption of a car change as its speed increases? The table contains data for a 2014 Chevrolet Cruze Turbo Diesel. Speed is measured in miles per hour, and fuel consumption is measured in miles per gallon. Speed 10 20 30 40 50 60 70 80 Fuel 38.1 54.0 68.4 63.6 60.5 55.4 50.6 43.8 To access the complete data set, click the link for your preferred software format: Excel Minitab JMP SPSS TI R Mac-TXT PC-TXT...
The data for per capita income and per capita alcohol consumption for 66 countries is given...
The data for per capita income and per capita alcohol consumption for 66 countries is given in the table. Here, x denotes income, in thousands of dollars, and y denotes alcohol consumed, in gallons per year. Use the information to complete parts left parenthesis a right parenthesis through(a) through (d). x 20.4 22.6 26.6 19.1 27.3 24.3 y 20.8 29.7 28.4 15.7 20.3 31.0 a. Graph the data points. A. 1535050IncomeAlcohol A scatterplot has a horizontal axis labeled Income from...
Consider the following data for two variables, x and y.
 Consider the following data for two variables, x and y. a. Choose the correct scatter diagram with x and y. The correct scatter diagram is - _______ . Does there appear to be a linear relationship between x and y? Explain. The scatter diagram- Select your answer - some evidence of a possible linear relationship. b. Develop the estimated regression equation relating x and y. Save "predicted" and "residuals" (to 4 decimals). c. Choose the correct scatter diagram or the residuals versus y tor the estimated...
The following data represent the time between eruptions and the length of eruption for 8 randomly...
The following data represent the time between eruptions and the length of eruption for 8 randomly selected geyser eruptions. Time, x Length, y 12.16 1.87 11.73 1.80 11.99 1.87 12.17 1.89 11.28 1.64 11.68 1.74 12.24 1.90 11.57 1.71 11.74 1.78 (a) What type of relation appears to exist between time between eruptions and length of eruption? A. Linear, negative association B. Linear, positive association Your answer is correct. C. A nonlinear pattern. D. No association. (b) Does the residual...
USE R STUDIO The stackloss data frame available in R contains 21 observations on four variables...
USE R STUDIO The stackloss data frame available in R contains 21 observations on four variables taken at a factory where ammonia is converted to nitric acid. The first three variables are Air.Flow, Water.Temp, and Acid.Conc. The fourth variable is stack.loss, which measures the amount of ammonia that escapes before being absorbed. Read the help file for more information about this data frame. - Give a numerical summarization of each column of the dataset, then use boxplots to help illustrating...
An artide gave a scatter plot along with the least squares line of x -rainfall volume (m3) and y ...
 An artide gave a scatter plot along with the least squares line of x -rainfall volume (m3) and y runoff volume (m3) for a particular location. The accompanying values were read from the plot. x14 12 14 17 23 30 40 52 55 67 72 85 96 112 127 y14 10 13 15 15 25 27 45 38 46 53 71 82 99 100 (a) Does a scatter plot of the data support the use of the simple linear regression...
Below are given (a) A scatterplot of Y versus X and (b) A plot of residuals...
 Below are given (a) A scatterplot of Y versus X and (b) A plot
of residuals versus fitted values after a simple linear regression
model was fit to the data. What is the equation of the fitted line?
Discuss what is indicated about the relationship between Y and X as
it relates to simple linear regression.
Fitted Line Plot Y = - 14.64 + 7.431 X R-Sq R-Sq (adj) 2.43700 91.9% 91.8% 1 > 20- 3 4 5 6 7...
Below are given (a) A scatterplot of Y versus X and (b) A plot
of residuals versus fitted values after a simple linear regression
model was fit to the data. What is the equation of the fitted line?
Discuss what is indicated about the relationship between Y and X as
it relates to simple linear regression.
Fitted Line Plot Y = - 14.64 + 7.431 X R-Sq R-Sq (adj) 2.43700 91.9% 91.8% 1 > 20- 3 4 5 6 7...
An article gave a scatter plot along with the least squares line of x = rainfall...
 An article gave a scatter plot
along with the least squares line of x = rainfall volume
(m3) and y = runoff volume (m3) for
a particular location. The accompanying values were read from the
plot.
x
5
12
14
20
23
30
40
51
55
67
72
85
96
112
127
y
4
10
13
15
15
25
27
45
38
46
53
75
82
99
103
(a) Does a scatter plot of the data support the use of...
An article gave a scatter plot
along with the least squares line of x = rainfall volume
(m3) and y = runoff volume (m3) for
a particular location. The accompanying values were read from the
plot.
x
5
12
14
20
23
30
40
51
55
67
72
85
96
112
127
y
4
10
13
15
15
25
27
45
38
46
53
75
82
99
103
(a) Does a scatter plot of the data support the use of...
 The following data represent the time between eruptions and the length of eruption for 8 randomly selected geyser eruptions. Complete parts (a) through (c) below. Click here to view a scatter plot of the data. Click here to view a residual plot of the data. Time, x 12.15 11.62 11.96 12.19 11.29 Length, y 1.86 1.74 1.81 1.93 1.67 Time, x 11.68 12.13 11.59 11.68 Length, y 1.78 1.85 1.75 1.71 (a) What type of relation appears to exist between...
 An artide gave a scatter plot along with the least squares line of x -rainfall volume (m3) and y runoff volume (m3) for a particular location. The accompanying values were read from the plot. x14 12 14 17 23 30 40 52 55 67 72 85 96 112 127 y14 10 13 15 15 25 27 45 38 46 53 71 82 99 100 (a) Does a scatter plot of the data support the use of the simple linear regression...
 Below are given (a) A scatterplot of Y versus X and (b) A plot
of residuals versus fitted values after a simple linear regression
model was fit to the data. What is the equation of the fitted line?
Discuss what is indicated about the relationship between Y and X as
it relates to simple linear regression.
Fitted Line Plot Y = - 14.64 + 7.431 X R-Sq R-Sq (adj) 2.43700 91.9% 91.8% 1 > 20- 3 4 5 6 7...
Below are given (a) A scatterplot of Y versus X and (b) A plot
of residuals versus fitted values after a simple linear regression
model was fit to the data. What is the equation of the fitted line?
Discuss what is indicated about the relationship between Y and X as
it relates to simple linear regression.
Fitted Line Plot Y = - 14.64 + 7.431 X R-Sq R-Sq (adj) 2.43700 91.9% 91.8% 1 > 20- 3 4 5 6 7...
 An article gave a scatter plot
along with the least squares line of x = rainfall volume
(m3) and y = runoff volume (m3) for
a particular location. The accompanying values were read from the
plot.
x
5
12
14
20
23
30
40
51
55
67
72
85
96
112
127
y
4
10
13
15
15
25
27
45
38
46
53
75
82
99
103
(a) Does a scatter plot of the data support the use of...
An article gave a scatter plot
along with the least squares line of x = rainfall volume
(m3) and y = runoff volume (m3) for
a particular location. The accompanying values were read from the
plot.
x
5
12
14
20
23
30
40
51
55
67
72
85
96
112
127
y
4
10
13
15
15
25
27
45
38
46
53
75
82
99
103
(a) Does a scatter plot of the data support the use of...
Most questions answered within 3 hours.
-
An explosion breaks a 20.0-kg object into three parts. The
object is initially moving at a...
asked 32 minutes ago -
Calculate the approximate number of residues of Rubisco, which
is involved in carbon fixation in plants,...
asked 1 hour ago -
Other decisions about scientific claims can have a much broader
impact.ENERGYarrow-10x10.png, environment, health, security - all...
asked 2 hours ago -
I need to write a research paper and work cited about this
topic: The United States...
asked 2 hours ago -
Hello! I was wondering if I could have some help?
If the vapor pressure of carvone...
asked 3 hours ago -
An economist wants to estimate the mean per capita income (in
thousands of dollars) for a...
asked 3 hours ago -
What would be the input/output characteristic of a circuit
obtained by putting two of your 2's-complementers...
asked 3 hours ago -
In Drosophila, the transition from the syncytial blastoderm
stage to the cellular blastoderm stage is a...
asked 3 hours ago -
Project management question:
Name 3 different types of resources (hint: humans are one
type)
asked 4 hours ago -
Consider the following reaction: C 2H 2( g) + 2H 2( g) C 2H 6(
g)...
asked 4 hours ago -
Consider a 1.0 L buffer containing 0.092 mol L-1 HCOOH and 0.100
mol L-1 HCOO-. What...
asked 4 hours ago -
Koch Realty has owned a vacant land with a FMV of
$775,000 and an adjusted basis...
asked 4 hours ago