Go to BEA.gov and in the U.S. Economic Accounts find Table 1.1.5 (nominal GDP) and Table...
- Go to BEA.gov and in the U.S. Economic Accounts find Table 1.1.5 (nominal GDP) and Table 1.1.6 (real GDP) and download them for the period 1960 to the latest available year in annual frequency (yearly).
- In Excel plot line 1 of both tables within a single graph. Where do they cross? Explain what is the relationship between real and nominal GDP before and after the crossing point? Why? (25 points)
- In Excel, using the formula “=ln( )” take the natural log of real GDP (line 1) and plot the change in GDP from one year to the next measured by ln(GDP(t)) - ln(GDP(t-1)). (If you multiply by 100, it will be a Belpercentage.) (25 points)
- In Excel using nominal GDP (table 1.1.5) calculate and plot the GDP shares of Consumption (line 2), Investment (line 7), Government (line 22), and Net Exports (line 15). For example, the consumption share is C/Y or line 2 / line 1. (25 points)
- Explain the relationship between national saving and net exports. (25 points)
All the charts should have a title and have the axis labeled (with time in the x-axis, and the label of the variable(s) and units in the y-axis).
Homework Answers
The nominal GDP is the value of goods and services produced within an economy in a country during a particular period of time. The real GDP is nominal GDP adjusted for a common price level.
Figure 1
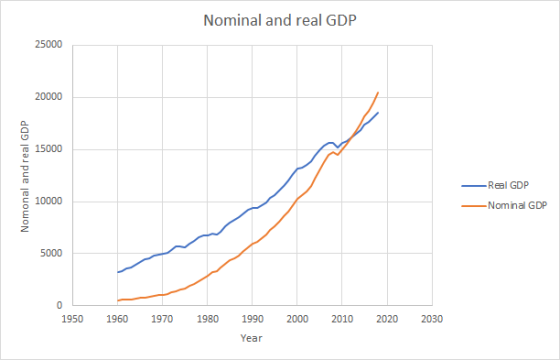
The real and nominal GDP crosses each other at the base year. because real GDP is expressed in base year price, the real GDP is equal to nominal GDP at the base year. In this case, the real GP is calculated in chained 2012 prices, then the real GDP crosses nominal GDP at the year 2012.
The nominal GDP is lower than real GDP before 2012 and it is higher after 2012. This is because, as inflation is positive mainly, year after year the price rises from one year to another. Therefore, when nominal GDP is adjusted to base year prices, it increases prior to 2012, because 2012 has higher prices than 1960 to 2011. The opposite is true for the years after 2012. As price continues to rise, the nominal GDP when adjusted for higher prices rose above real GDP after 2012.
Figure 2

Table 1
| Year | C/Y | I/Y | NX/Y | G/Y |
| 1960 | 0.610619 | 0.159476 | 0.007743 | 0.222161 |
| 1961 | 0.607435 | 0.154038 | 0.008716 | 0.229811 |
| 1962 | 0.600431 | 0.160623 | 0.006789 | 0.232323 |
| 1963 | 0.599216 | 0.162039 | 0.007686 | 0.230902 |
| 1964 | 0.599854 | 0.163915 | 0.01008 | 0.22615 |
| 1965 | 0.596794 | 0.174592 | 0.007544 | 0.22107 |
| 1966 | 0.589993 | 0.177281 | 0.004795 | 0.227932 |
| 1967 | 0.589186 | 0.16593 | 0.004186 | 0.240698 |
| 1968 | 0.592006 | 0.166791 | 0.001488 | 0.239715 |
| 1969 | 0.59316 | 0.170597 | 0.001376 | 0.234866 |
| 1970 | 0.602534 | 0.15839 | 0.003634 | 0.235349 |
| 1971 | 0.600824 | 0.168942 | 0.000515 | 0.229633 |
| 1972 | 0.600579 | 0.178329 | -0.00266 | 0.223751 |
| 1973 | 0.596043 | 0.187246 | 0.002876 | 0.213835 |
| 1974 | 0.601993 | 0.177647 | -0.00052 | 0.220942 |
| 1975 | 0.611609 | 0.152709 | 0.009496 | 0.226186 |
| 1976 | 0.612629 | 0.172521 | -0.00085 | 0.215757 |
| 1977 | 0.61197 | 0.190508 | -0.0111 | 0.208618 |
| 1978 | 0.604822 | 0.203436 | -0.0108 | 0.202543 |
| 1979 | 0.603433 | 0.20542 | -0.00856 | 0.199749 |
| 1980 | 0.612711 | 0.185525 | -0.00458 | 0.206349 |
| 1981 | 0.603056 | 0.196819 | -0.0039 | 0.204054 |
| 1982 | 0.619445 | 0.173754 | -0.00598 | 0.212782 |
| 1983 | 0.627848 | 0.175427 | -0.0142 | 0.210952 |
| 1984 | 0.617273 | 0.203116 | -0.02544 | 0.205048 |
| 1985 | 0.625213 | 0.191219 | -0.02627 | 0.209841 |
| 1986 | 0.630252 | 0.185409 | -0.0288 | 0.213141 |
| 1987 | 0.633609 | 0.183762 | -0.02982 | 0.212453 |
| 1988 | 0.635933 | 0.17894 | -0.02089 | 0.206038 |
| 1989 | 0.634005 | 0.177202 | -0.01537 | 0.20418 |
| 1990 | 0.638762 | 0.166591 | -0.01306 | 0.207711 |
| 1991 | 0.64036 | 0.153343 | -0.00464 | 0.210942 |
| 1992 | 0.643774 | 0.155361 | -0.00532 | 0.206202 |
| 1993 | 0.649112 | 0.161374 | -0.00951 | 0.199006 |
| 1994 | 0.647848 | 0.172426 | -0.01269 | 0.192433 |
| 1995 | 0.64958 | 0.172454 | -0.01175 | 0.189719 |
| 1996 | 0.649639 | 0.177392 | -0.01194 | 0.18491 |
| 1997 | 0.645495 | 0.186019 | -0.01189 | 0.180365 |
| 1998 | 0.648497 | 0.19163 | -0.01795 | 0.177826 |
| 1999 | 0.651988 | 0.195946 | -0.02656 | 0.178637 |
| 2000 | 0.659569 | 0.198824 | -0.03659 | 0.178184 |
| 2001 | 0.667712 | 0.182842 | -0.03477 | 0.184213 |
| 2002 | 0.6714 | 0.176511 | -0.0389 | 0.190986 |
| 2003 | 0.674024 | 0.176913 | -0.04391 | 0.19298 |
| 2004 | 0.672417 | 0.186782 | -0.05069 | 0.191498 |
| 2005 | 0.670965 | 0.19443 | -0.05532 | 0.189927 |
| 2006 | 0.670327 | 0.195518 | -0.0558 | 0.189958 |
| 2007 | 0.671635 | 0.184958 | -0.04971 | 0.19311 |
| 2008 | 0.678069 | 0.168398 | -0.04915 | 0.202681 |
| 2009 | 0.681173 | 0.133553 | -0.02744 | 0.212715 |
| 2010 | 0.679411 | 0.144443 | -0.03428 | 0.210417 |
| 2011 | 0.684641 | 0.150078 | -0.03728 | 0.202566 |
| 2012 | 0.679558 | 0.161869 | -0.03511 | 0.193678 |
| 2013 | 0.674249 | 0.168366 | -0.02924 | 0.18662 |
| 2014 | 0.67482 | 0.173436 | -0.02901 | 0.180747 |
| 2015 | 0.674806 | 0.176297 | -0.02862 | 0.177515 |
| 2016 | 0.682459 | 0.169448 | -0.02783 | 0.175922 |
| 2017 | 0.683661 | 0.172847 | -0.02968 | 0.173176 |
| 2018 | 0.680546 | 0.178151 | -0.03052 | 0.171824 |
Figure 3
 Figure 3
The national savings of the economy is the sum of private and public savings. This is given as


Add Answer to:
Go to BEA.gov and in the U.S. Economic Accounts find Table
1.1.5 (nominal GDP) and Table...
Suppose that 25 years ago a country had nominal GDP of 1000, a GDP deflator of...
 Suppose that 25 years ago a country had nominal GDP of 1000, a GDP deflator of 200, and a population of 100. Today, that country has a nominal GDP of 3000, a deflator of 400, and a population of 150. What happened to the real GDP per person? O alt rose, but less than doubled O b. It did not change O c. It more than doubled Od. It fell Makena buys a designer dress produced by a Canadian-owned fashion...
Part 1: Expenditures Approach to Calculating GDP (weight 25% of the assignment grade) Complete the following...
Part 1: Expenditures Approach to Calculating GDP (weight 25% of the assignment grade) Complete the following exercise. Visit the Bureau of Economic Analysis website at www.bea.gov. From the drop-down menu under “Data”, click on “by Economics Account”. Then click on “National”, “Gross Domestic Product, and “Full Release and Tables”. Use table 3 (Gross Domestic Product: Level and Change from Preceding Period). The left columns are nominal GDP (and its components) and the right half represents real GDP (chained 2012 dollars)...
MUST BE 2017 Data exercise #1 Part 1: Expenditures Approach to Calculating GDP (weight 25% of...
MUST BE 2017 Data exercise #1 Part 1: Expenditures Approach to Calculating GDP (weight 25% of the assignment grade) Complete the following exercise Visit the Bureau of Economic Analysis website at www.bea.gov. From the drop-down menu under “Data”, click on “by Economics Account”. Then click on “National”, “Gross Domestic Product, and “Full Release and Tables”. Use table 3 (Gross Domestic Product: Level and Change from Preceding Period). The left columns are nominal GDP (and its components) and the right half...
Question 2 The following table shows quarterly data of U.S. nominal and real GDP in 2018....
 Question 2 The following table shows quarterly data of U.S. nominal and real GDP in 2018. Use the information to calculate items (a), (b), and (c): 2018 01 20,04120,411.9 02 | 03 20,658.2 18,511.6 18,665 Nominal GDP (billions of dollars Real GDP (billions of 2012 dollars)18,3241 a. (2 points) Calculate the growth rate of nominal GDP in second and third quarters of b. (2 points) Calculate the growth rate of real GDP in second and third quarters of 2018. 2018....
Question 2 The following table shows quarterly data of U.S. nominal and real GDP in 2018....
 Question 2 The following table shows quarterly data of U.S. nominal and real GDP in 2018. Use the information to calculate items (a), (b), and (c): 2018 02 Nominal GDP (billions of dollars)20,041 Real GDP (billions of 2012 dollars 18,324 Q1 041 20,411.9 03 20,658.2 18,665 18,511.6 a. (2 points) Calculate the growth rate of nominal GDP in second and third quarters of 2018. b. (2 points) Calculate the growth rate of real GDP in second and third quarters of...
7. The following table shows nominal GDP and an appropriate price index for a group of...
 7. The following table shows nominal GDP and an appropriate price index for a group of selected years. Compute real GDP. Indicate in each calculation whether you are inflating or deflating the nominal GDP data, Instructions: Enter your responses in the gray-shaded cells. Round your answers to 2 decimal places. 0.74 points Real GDP, Billions Effect on Nominal GDP Year Book 1968 1978 1968 1995 2008 Nominal GDP Billions $914.80 2298.80 5105.40 8798 50 1446.40 Frice Index (2005 - 100)...
Based on the table below, calculate nominal GDP real GDP, the GDP deflator, and the infation...
 Based on the table below, calculate nominal GDP real GDP, the GDP deflator, and the infation rate in each year and fill in the missing parts of the table Use 2010 as the base year Instructions: Round nominal and real GDP values to two decimal places. Round GDP deflator and inflation rate values to the nearest whole number Quantity Price of Quantity Price of Real GOP ($) GOP deflator Inflation rate (%) Year of orange of beach beach ball GDP...
Due Monday, January 21, 2019 1. Nominal and real GDP nying table shows data on nominal...
 Due Monday, January 21, 2019 1. Nominal and real GDP nying table shows data on nominal GDP (in billions of dollars), real GDP (in bilions of 2007 dollars), and population (in thousands) of Canada in 1966, 1976, 1986, 1996, 2006, and 2016. The Canadian price level rose consistently over the period 1966-2016. Nominal GDP bitlions ofbitions of Population ollans2007 dollar) Chous $64.8 200.0 524.5 8570 $431.9 658.0 19 998 23 414 26 067 29 570 32 520 36 229 1976...
1. Aggregate expenditure and income The following table shows consumption (C), investment (I), government purchases (G),...
1. Aggregate expenditure and income The following table shows consumption (C), investment (I), government purchases (G), and net exports (X−IM) in a hypothetical economy for various levels of real GDP (Y). Assume that the price level remains unchanged at all levels of income. All figures are in billions of dollars. Compute total expenditure for each income level, and fill in the last column in the following table. Y C I G X−IM Total Expenditure 500 300 150 200 -100 600...
Wk 1- Apply: Output, Income, and Economic Growth Homework – One Atte.. Saved The GDP price...
 Wk 1- Apply: Output, Income, and Economic Growth Homework – One Atte.. Saved The GDP price index equals 3.4 Multiple Choice points gross national product less net foreign factor income earned in the United States real GDP divided by nominal GDP nominal GDP divided by real GDP gross private domestic investment less the consumption of fixed capital
 Suppose that 25 years ago a country had nominal GDP of 1000, a GDP deflator of 200, and a population of 100. Today, that country has a nominal GDP of 3000, a deflator of 400, and a population of 150. What happened to the real GDP per person? O alt rose, but less than doubled O b. It did not change O c. It more than doubled Od. It fell Makena buys a designer dress produced by a Canadian-owned fashion...
 Question 2 The following table shows quarterly data of U.S. nominal and real GDP in 2018. Use the information to calculate items (a), (b), and (c): 2018 01 20,04120,411.9 02 | 03 20,658.2 18,511.6 18,665 Nominal GDP (billions of dollars Real GDP (billions of 2012 dollars)18,3241 a. (2 points) Calculate the growth rate of nominal GDP in second and third quarters of b. (2 points) Calculate the growth rate of real GDP in second and third quarters of 2018. 2018....
 Question 2 The following table shows quarterly data of U.S. nominal and real GDP in 2018. Use the information to calculate items (a), (b), and (c): 2018 02 Nominal GDP (billions of dollars)20,041 Real GDP (billions of 2012 dollars 18,324 Q1 041 20,411.9 03 20,658.2 18,665 18,511.6 a. (2 points) Calculate the growth rate of nominal GDP in second and third quarters of 2018. b. (2 points) Calculate the growth rate of real GDP in second and third quarters of...
 7. The following table shows nominal GDP and an appropriate price index for a group of selected years. Compute real GDP. Indicate in each calculation whether you are inflating or deflating the nominal GDP data, Instructions: Enter your responses in the gray-shaded cells. Round your answers to 2 decimal places. 0.74 points Real GDP, Billions Effect on Nominal GDP Year Book 1968 1978 1968 1995 2008 Nominal GDP Billions $914.80 2298.80 5105.40 8798 50 1446.40 Frice Index (2005 - 100)...
 Based on the table below, calculate nominal GDP real GDP, the GDP deflator, and the infation rate in each year and fill in the missing parts of the table Use 2010 as the base year Instructions: Round nominal and real GDP values to two decimal places. Round GDP deflator and inflation rate values to the nearest whole number Quantity Price of Quantity Price of Real GOP ($) GOP deflator Inflation rate (%) Year of orange of beach beach ball GDP...
 Due Monday, January 21, 2019 1. Nominal and real GDP nying table shows data on nominal GDP (in billions of dollars), real GDP (in bilions of 2007 dollars), and population (in thousands) of Canada in 1966, 1976, 1986, 1996, 2006, and 2016. The Canadian price level rose consistently over the period 1966-2016. Nominal GDP bitlions ofbitions of Population ollans2007 dollar) Chous $64.8 200.0 524.5 8570 $431.9 658.0 19 998 23 414 26 067 29 570 32 520 36 229 1976...
 Wk 1- Apply: Output, Income, and Economic Growth Homework – One Atte.. Saved The GDP price index equals 3.4 Multiple Choice points gross national product less net foreign factor income earned in the United States real GDP divided by nominal GDP nominal GDP divided by real GDP gross private domestic investment less the consumption of fixed capital
Most questions answered within 3 hours.
-
For the reaction 1N2+3H2-----> 2NH3, would the reaction rate
trend be: delta[NH3]/ delta t = -2...
asked 26 minutes ago -
Within your current/past organization, identify a problem/issue
and format a design to address same. You may...
asked 8 minutes ago -
A sock stuck to the side of a clothes-dryer barrel has a
centripetal acceleration of 24...
asked 1 hour ago -
A perfect gas undergoes an isentropic process such that its
volume doubles. If the ratio of...
asked 1 hour ago -
list the elements in groups 3A to 6A in the same order as in the
periodic...
asked 1 hour ago -
Estimating effect size. Peng and Chen (2014)
evaluated effect size estimates for various tests. In their...
asked 1 hour ago -
Write a script in MySQL that creates and calls a stored
procedure name test. This procedure...
asked 1 hour ago -
If we test the following: H0: μ = 17
vs. H1: μ ≠ 17 and the...
asked 2 hours ago -
in the past year TVG had revenues of 3 million, cost
of goods sold of $25...
asked 2 hours ago -
4) In a polypeptide, which bond cannot rotate because of its
partial double bond character?
The...
asked 2 hours ago -
Assume that in the short run L = 1,000 and K = 100. 1. What is...
asked 2 hours ago -
At a given temperature, 2.06 atm of H2 and 3.7 atm of Br2 are
mixed and...
asked 2 hours ago