1.On the graph below, make a neat and labeled sketch of the signal s(t) = 2...
1.On the graph below, make a neat and labeled sketch of the signal s(t) = 2 + cos( t/4 + 1 ),Describe s(t) as odd, even, or neither. What is the energy in s(t)? What is the power in s(t)?
2.On the graph below, make a neat and labeled sketch of the signal s(t) = 3 rect( t - 2 ) cos( π t ),Describe s(t) as odd, even, or neither. What is the energy in s(t)? What is the power in s(t)?
2.On the graph below, make a neat and labeled sketch of the signal s(t) = 3 rect( t/4 + 1 ),
3.On the graph below, make a neat and labeled sketch of the signal s(t) = 3 cos( 2 π t/4 + π )
4.Evaluate the integral −∞ +∞ ∫δ (t + 1 2 ) cos(2πt) dt and explain your work.
Homework Answers
1.Ans)
The plot of 
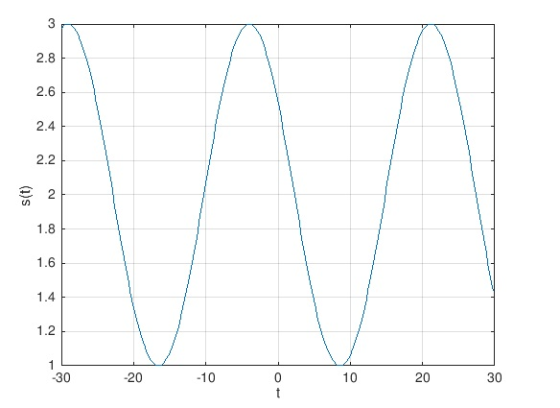
as  the signal is neither even nor odd
=============
Energy is given as


=================
The period of signal
is

Power is given as


=================
As per HomeworkLib rules only one question per post will be answered please
Add Answer to:
1.On the graph below, make a neat and labeled sketch of the
signal s(t) = 2...
Question #4: Consider the signal x(t) cos(2π (a) Sketch the signal. Please make sure to label...
 Question #4: Consider the signal x(t) cos(2π (a) Sketch the signal. Please make sure to label all relevant features. (b) Is the signal continuous or discrete? Explain. (c) Is the signal even, odd, or neither? Demonstrate
(a) Determine the Fourier transform of x(t) 26(t-1)-6(t-3) (b) Compute the convolution sum of the following signals, (6%) [696] (c) The Fourier transform of a continuous-time signal a(t) is given bel...
 (a) Determine the Fourier transform of x(t) 26(t-1)-6(t-3) (b) Compute the convolution sum of the following signals, (6%) [696] (c) The Fourier transform of a continuous-time signal a(t) is given below. Determine the [696] total energy of (t) 4 sin w (d) Determine the DC value and the average power of the following periodic signal. (6%) 0.5 0.5 (e) Determine the Nyquist rate for the following signal. (6%) x(t) = [1-0.78 cos(50nt + π/4)]2. (f) Sketch the frequency spectrum of...
JU Q1. Sketch the following SIGNALS and determine for each whether it is: Periodic or aperiodic....
 JU Q1. Sketch the following SIGNALS and determine for each whether it is: Periodic or aperiodic. If periodic, • Even, odd, or neither. If it is neither, specify To. decompose it into even part Ev{x} Energy signal, power signal, or and odd part Od{x} and sketch them. neither. Find the total energy E. and average power PC- 12 -1<n<1 (a) xa n] = lo otherwise (b) xo(t) = xy(t) + x2(t), where x,(t) and x2(t) are the signals shown below:...
Transformations of independent variable 1. A discrete time signal is shown below. Sketch and care...
 Please Answer the following questions ASAP. Thanks!
Transformations of independent variable 1. A discrete time signal is shown below. Sketch and carefully label x [2n 1 and xl-nlul-n1. 2. A continuous time signal x(t) is shown below. Sketch and carefully label x(t-1) and x(-t)-x(t)u(-t x(t) Even and Odd 3. Sketch x()Ev(sin(5mt)u(-t))for-1ts1 . Sketch the even and odd parts of signal x[n] in problem 1.
Transformations of independent variable 1. A discrete time signal is shown below. Sketch and carefully label...
Please Answer the following questions ASAP. Thanks!
Transformations of independent variable 1. A discrete time signal is shown below. Sketch and carefully label x [2n 1 and xl-nlul-n1. 2. A continuous time signal x(t) is shown below. Sketch and carefully label x(t-1) and x(-t)-x(t)u(-t x(t) Even and Odd 3. Sketch x()Ev(sin(5mt)u(-t))for-1ts1 . Sketch the even and odd parts of signal x[n] in problem 1.
Transformations of independent variable 1. A discrete time signal is shown below. Sketch and carefully label...
1. Given, the rational function below, sketch a neat and labeled graph by filling in each...
 1. Given, the rational function below, sketch a neat and labeled graph by filling in each of the blanks with appropriate work: 2x² + 8x f(x)= x-2 a) Domain in intervals b) Equation of vertical asymptote(s), if any c) Equation of horizontal asymptote or slant asymptote, if any (write n and m). d) Ordered pair(s) of point where function touches its horizontal or slant asymptote c) x-intercept(s) and its y-intercept, if any Test for symmetry and state your conclusion
3. An amplitude-modulated (AM) signal is given by s(t)-[12+7cos(π-π/3)]cos(13m). (a) Express s(t) in the form of...
 3. An amplitude-modulated (AM) signal is given by s(t)-[12+7cos(π-π/3)]cos(13m). (a) Express s(t) in the form of A cos( +4)-A, cos(o,t + φ2) + A3 cos(wyt + φ3). (b) Sketch the amplitude and phase spectra of s(t)
please do part b lenterel t 2. For the signal u(-t-2) wh (a) graph the signal...
 please do part b
lenterel t 2. For the signal u(-t-2) wh (a) graph the signal and provide y-axis values on the graph (t+1) T T -10 -5 -4 3 -2 -1 1 2 3 6 4 5 7 10 (b) calculate the signal energy or power, as appropriate LC
please do part b
lenterel t 2. For the signal u(-t-2) wh (a) graph the signal and provide y-axis values on the graph (t+1) T T -10 -5 -4 3 -2 -1 1 2 3 6 4 5 7 10 (b) calculate the signal energy or power, as appropriate LC
Q1) For the continuous time signal below, x(t)=1+t (a) Determine the even and odd parts of...
 Q1) For the continuous time signal below, x(t)=1+t (a) Determine the even and odd parts of the signal. (b) Sketch the signal from t = -3 to t = 3. (c) Explain why the signal does not possess BIBO stability.
Plot the signal s(t) = cos(2πt), and then illustrate the resulting samples with the following sampling...
Plot the signal s(t) = cos(2πt), and then illustrate the resulting samples with the following sampling intervals: [30 points] • Ts= 0.5 sec. • Ts= 0.75 sec • Ts =1 sec. (a) For each case, also sketch the reconstructed continuous time signal from the samples using linear interpolation (i.e. connecting samples by straight lines). (b) In which case the sampled signal has aliasing distortion? What is the minimal sampling frequency and the corresponding sampling interval needed to avoid aliasing? 3....
 Question #4: Consider the signal x(t) cos(2π (a) Sketch the signal. Please make sure to label all relevant features. (b) Is the signal continuous or discrete? Explain. (c) Is the signal even, odd, or neither? Demonstrate
 (a) Determine the Fourier transform of x(t) 26(t-1)-6(t-3) (b) Compute the convolution sum of the following signals, (6%) [696] (c) The Fourier transform of a continuous-time signal a(t) is given below. Determine the [696] total energy of (t) 4 sin w (d) Determine the DC value and the average power of the following periodic signal. (6%) 0.5 0.5 (e) Determine the Nyquist rate for the following signal. (6%) x(t) = [1-0.78 cos(50nt + π/4)]2. (f) Sketch the frequency spectrum of...
 JU Q1. Sketch the following SIGNALS and determine for each whether it is: Periodic or aperiodic. If periodic, • Even, odd, or neither. If it is neither, specify To. decompose it into even part Ev{x} Energy signal, power signal, or and odd part Od{x} and sketch them. neither. Find the total energy E. and average power PC- 12 -1<n<1 (a) xa n] = lo otherwise (b) xo(t) = xy(t) + x2(t), where x,(t) and x2(t) are the signals shown below:...
 Please Answer the following questions ASAP. Thanks!
Transformations of independent variable 1. A discrete time signal is shown below. Sketch and carefully label x [2n 1 and xl-nlul-n1. 2. A continuous time signal x(t) is shown below. Sketch and carefully label x(t-1) and x(-t)-x(t)u(-t x(t) Even and Odd 3. Sketch x()Ev(sin(5mt)u(-t))for-1ts1 . Sketch the even and odd parts of signal x[n] in problem 1.
Transformations of independent variable 1. A discrete time signal is shown below. Sketch and carefully label...
Please Answer the following questions ASAP. Thanks!
Transformations of independent variable 1. A discrete time signal is shown below. Sketch and carefully label x [2n 1 and xl-nlul-n1. 2. A continuous time signal x(t) is shown below. Sketch and carefully label x(t-1) and x(-t)-x(t)u(-t x(t) Even and Odd 3. Sketch x()Ev(sin(5mt)u(-t))for-1ts1 . Sketch the even and odd parts of signal x[n] in problem 1.
Transformations of independent variable 1. A discrete time signal is shown below. Sketch and carefully label...
 1. Given, the rational function below, sketch a neat and labeled graph by filling in each of the blanks with appropriate work: 2x² + 8x f(x)= x-2 a) Domain in intervals b) Equation of vertical asymptote(s), if any c) Equation of horizontal asymptote or slant asymptote, if any (write n and m). d) Ordered pair(s) of point where function touches its horizontal or slant asymptote c) x-intercept(s) and its y-intercept, if any Test for symmetry and state your conclusion
 3. An amplitude-modulated (AM) signal is given by s(t)-[12+7cos(π-π/3)]cos(13m). (a) Express s(t) in the form of A cos( +4)-A, cos(o,t + φ2) + A3 cos(wyt + φ3). (b) Sketch the amplitude and phase spectra of s(t)
 please do part b
lenterel t 2. For the signal u(-t-2) wh (a) graph the signal and provide y-axis values on the graph (t+1) T T -10 -5 -4 3 -2 -1 1 2 3 6 4 5 7 10 (b) calculate the signal energy or power, as appropriate LC
please do part b
lenterel t 2. For the signal u(-t-2) wh (a) graph the signal and provide y-axis values on the graph (t+1) T T -10 -5 -4 3 -2 -1 1 2 3 6 4 5 7 10 (b) calculate the signal energy or power, as appropriate LC
 Q1) For the continuous time signal below, x(t)=1+t (a) Determine the even and odd parts of the signal. (b) Sketch the signal from t = -3 to t = 3. (c) Explain why the signal does not possess BIBO stability.
Most questions answered within 3 hours.
-
Humans have used horses for transportation for millions of
years. Therefore, they will use horses for...
asked 1 hour ago -
The following are the Jensen Corporation's unit costs of making
and selling an item at a...
asked 2 hours ago -
Does direct Medicare reimbursement of Advanced practice nurses
increase access to their services?
asked 2 hours ago -
List and explain why a company would choose to use a
published
compensation survey vs. creating...
asked 3 hours ago -
A discrete random variable X can take values from 1 to 10. Find
the variance of...
asked 3 hours ago -
The primary financial goal of a corporation is to maximize:
shareholders wealth.
earnings per share.
stock...
asked 3 hours ago -
determine whether the vectors u=(1,2,3,), v=(-2,1,0) and
w=(1,0,1) are linearly dependent or independent.
asked 3 hours ago -
python
Define a function called print_values which takes a dictionary
object as a parameter. The function...
asked 4 hours ago -
In Chapter 1 you created a program named Triangle in
which you displayed a seven-line triangle...
asked 4 hours ago -
Research question: What are the differences between separately
stated and non separately stated transactions in an...
asked 4 hours ago -
By using Arduino write a code that connects two LEDs to two
push-buttons. Each button controls...
asked 5 hours ago -
Bank of America has bonds that pay a coupon interest rate of 5.5
percent and mature...
asked 6 hours ago