Number of Successes Frequency Relative Frequency 0 10 0.13889 1 29 0.40278 2 26 0.36111 3...
| Number of Successes | Frequency | Relative Frequency |
| 0 | 10 | 0.13889 |
| 1 | 29 | 0.40278 |
| 2 | 26 | 0.36111 |
| 3 | 4 | 0.05556 |
| 4 | 3 | 0.04167 |
| Total | 72 | 1.00 |
| Mean of Successes | 1.458 |
Using the frequency distribution, what is the tractor sales success average? In part 3, note that the numerator in the formula for the mean is the total number of successes. The total number of trials is the denominator of the formula for the mean multiplied by 4. What does this average mean?
Homework Answers
Formula for average success is
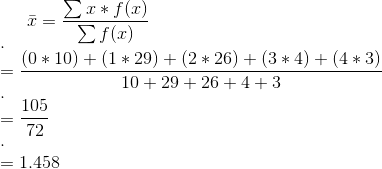
This is the average value of tractor sales success, i.e., this means that the tractor sales success on an average is 1.458.
Add Answer to:
Number of Successes
Frequency
Relative Frequency
0
10
0.13889
1
29
0.40278
2
26
0.36111
3...
The success average of a hockey player is the number of “points scored” divided by the...
 The success average of a hockey player is the number of “points
scored” divided by the number of “shots on goal.” Recently, a
certain professional league player’s shots on goal and
corresponding points scored were recorded for 400 consecutive
games. The consecutive games span more than one season. Since each
game is different, the number of shots and points scored both vary.
For this particular player, there were from 0 to 15 shots. Thus,
one can sort the more than...
The success average of a hockey player is the number of “points
scored” divided by the number of “shots on goal.” Recently, a
certain professional league player’s shots on goal and
corresponding points scored were recorded for 400 consecutive
games. The consecutive games span more than one season. Since each
game is different, the number of shots and points scored both vary.
For this particular player, there were from 0 to 15 shots. Thus,
one can sort the more than...
The batting average of a baseball player is the number of “hits” divided by the number of “at-bats.” Recently, a certain...
 The batting average of a baseball player is the number of “hits”
divided by the number of “at-bats.” Recently, a certain major
league player’s at-bats and corresponding hits were recorded for
200 consecutive games. The consecutive games span more than one
season. Since each game is different, the number of at-bats and
hits both vary. For this particular player, there were from zero to
five at-bats. Thus, one can sort the 200 games into six
categories:
0 at-bats
1 at-bat...
The batting average of a baseball player is the number of “hits”
divided by the number of “at-bats.” Recently, a certain major
league player’s at-bats and corresponding hits were recorded for
200 consecutive games. The consecutive games span more than one
season. Since each game is different, the number of at-bats and
hits both vary. For this particular player, there were from zero to
five at-bats. Thus, one can sort the 200 games into six
categories:
0 at-bats
1 at-bat...
Option #1: Batting The batting average of a baseball player is the number of “hits” divided by the number of “at-bats.”...
Option #1: Batting The batting average of a baseball player is the number of “hits” divided by the number of “at-bats.” Recently, a certain major league player’s at-bats and corresponding hits were recorded for 200 consecutive games. The consecutive games span more than one season. Since each game is different, the number of at-bats and hits both vary. For this particular player, there were from zero to five at-bats. Thus, one can sort the 200 games into six categories: 0...
For each Bernoulli process, find the expected number of successes: 1. Number of trials =10, Probability...
For each Bernoulli process, find the expected number of successes: 1. Number of trials =10, Probability of success =0.6 2. Number of trials =210, Probability of success =1/10. 3. Number of trials =43, Probability of success =0.3. 4. Number of trials =23, Probability of failure =0.8. 5. Number of trials =59, Probability of failure =2/7.
Exercise 3: Show that (X/n)2 and X(X - 1)/n(n - 1) are both consistent estimates of p2 where X is the number of successes in n trials with constant probability p of success. Exercise 3: Show tha...
 Exercise 3: Show that (X/n)2 and X(X - 1)/n(n - 1) are both consistent estimates of p2 where X is the number of successes in n trials with constant probability p of success.
Exercise 3: Show that (X/n)2 and X(X - 1)/n(n - 1) are both consistent estimates of p2 where X is the number of successes in n trials with constant probability p of success.
Exercise 3: Show that (X/n)2 and X(X - 1)/n(n - 1) are both consistent estimates of p2 where X is the number of successes in n trials with constant probability p of success.
1. Given that x has a Poisson distribution with μ=4, what is the probability that x=6?...
1. Given that x has a Poisson distribution with μ=4, what is the probability that x=6? Round to four decimals. 2. Assume the Poisson distribution applies. Use the given mean to find the indicated probability. Find P(4) when μ=7. Round to the nearest thousandth. 3. Given that x has a Poisson distribution with μ=0.4, what is the probability that x=4? Round to the nearest thousandth. 4. Describe the difference between the value of x in a binomial distribution and in...
(a) Construct a relative frequency histogram for the ideal number of children. Choose the correct graph...
 (a) Construct a relative frequency histogram for the ideal number of children. Choose the correct graph below. OA B. OC. 0.67 0.47 0.44 0.24 0.27 3 HIIL 0 2 4 6 8 10 en 02 4 6 8 10 0 2 4 6 8 10 0 2 4 6 8 10 Comment on the shape of the distribution. Choose the correct answer below. O A. The distribution is skewed left. B. The distribution is skewed right. OC. The distribution is...
Step 1: Make a table as shown: Tally Frequency Percent(or relative frequency) Class Step 3: Tally...
 Step 1: Make a table as shown: Tally Frequency Percent(or relative frequency) Class Step 3: Tally the data and place the results in column *"Tally". Step 4: Count the tallies and place the result in column "Frequency" Step 5: Find the percentage of values in each class by using the formula: % = ftn 100% Step 2: List the classes in column "Class". Where f = frequency of the class and n - total number of values. The decimal equivalent...
Televisions Households 0 29 1 445 2 724 3 1404 (a) Use the frequency distribution to...
Televisions Households 0 29 1 445 2 724 3 1404 (a) Use the frequency distribution to construct a probability distribution. x p(x) 0 1 2 3 (c) Find the mean of the probability distribution. d)Find the variance of the probability distribution. e) find the standar deviation
No. of Errors (x) Relative Frequency 0 0.56 1 0.21 2 0.13 3 0.07 4 0.03...
No. of Errors (x) Relative Frequency 0 0.56 1 0.21 2 0.13 3 0.07 4 0.03 a) Using the relative frequency as probabilities, what is the expected number of errors? Interpret what this value means to the managing editor. b) Compute the variance and standard deviation for the number of errors and explain what these values measure.
 The success average of a hockey player is the number of “points
scored” divided by the number of “shots on goal.” Recently, a
certain professional league player’s shots on goal and
corresponding points scored were recorded for 400 consecutive
games. The consecutive games span more than one season. Since each
game is different, the number of shots and points scored both vary.
For this particular player, there were from 0 to 15 shots. Thus,
one can sort the more than...
The success average of a hockey player is the number of “points
scored” divided by the number of “shots on goal.” Recently, a
certain professional league player’s shots on goal and
corresponding points scored were recorded for 400 consecutive
games. The consecutive games span more than one season. Since each
game is different, the number of shots and points scored both vary.
For this particular player, there were from 0 to 15 shots. Thus,
one can sort the more than...
 The batting average of a baseball player is the number of “hits”
divided by the number of “at-bats.” Recently, a certain major
league player’s at-bats and corresponding hits were recorded for
200 consecutive games. The consecutive games span more than one
season. Since each game is different, the number of at-bats and
hits both vary. For this particular player, there were from zero to
five at-bats. Thus, one can sort the 200 games into six
categories:
0 at-bats
1 at-bat...
The batting average of a baseball player is the number of “hits”
divided by the number of “at-bats.” Recently, a certain major
league player’s at-bats and corresponding hits were recorded for
200 consecutive games. The consecutive games span more than one
season. Since each game is different, the number of at-bats and
hits both vary. For this particular player, there were from zero to
five at-bats. Thus, one can sort the 200 games into six
categories:
0 at-bats
1 at-bat...
 Exercise 3: Show that (X/n)2 and X(X - 1)/n(n - 1) are both consistent estimates of p2 where X is the number of successes in n trials with constant probability p of success.
Exercise 3: Show that (X/n)2 and X(X - 1)/n(n - 1) are both consistent estimates of p2 where X is the number of successes in n trials with constant probability p of success.
Exercise 3: Show that (X/n)2 and X(X - 1)/n(n - 1) are both consistent estimates of p2 where X is the number of successes in n trials with constant probability p of success.
 (a) Construct a relative frequency histogram for the ideal number of children. Choose the correct graph below. OA B. OC. 0.67 0.47 0.44 0.24 0.27 3 HIIL 0 2 4 6 8 10 en 02 4 6 8 10 0 2 4 6 8 10 0 2 4 6 8 10 Comment on the shape of the distribution. Choose the correct answer below. O A. The distribution is skewed left. B. The distribution is skewed right. OC. The distribution is...
 Step 1: Make a table as shown: Tally Frequency Percent(or relative frequency) Class Step 3: Tally the data and place the results in column *"Tally". Step 4: Count the tallies and place the result in column "Frequency" Step 5: Find the percentage of values in each class by using the formula: % = ftn 100% Step 2: List the classes in column "Class". Where f = frequency of the class and n - total number of values. The decimal equivalent...
Most questions answered within 3 hours.
-
Le Terroir Winery is considering an expansion project to produce
fine wines. The trial expansion will...
asked 2 minutes from now -
The Bahraini public budget experiences deficit in the last
seven years, what are procedures are taken...
asked 4 minutes ago -
You invested $30,000 in a mutual fund at the beginning of the
year when the NAV...
asked 8 minutes ago -
Would you expect the price elasticity of supply for guitars to
be more inelastic in the...
asked 10 minutes ago -
A snowmobile is originally at the point with position vector
30.1 m at 95.0° counterclockwise from...
asked 10 minutes ago -
MAN3240 Organizational Behavior
In one to two paragraphs
6.) How can understanding emotions make me more...
asked 18 minutes ago -
Identify one individual who, in your opinion, is an excellent
leader. List the qualities that this...
asked 15 minutes ago -
For the data set shown below, complete parts (a) through (d)
below. x 3 4 5...
asked 21 minutes ago -
A university administrator working in student housing wants to
determine if the percentage of students residing...
asked 35 minutes ago -
3). Describe human population growth that has occurred in the
past 400 years. Use terms learned...
asked 32 minutes ago -
A
projectile is blue at a target. The distance from the point of
impact to the...
asked 57 minutes ago -
Given a 32 bit processor, with 2 MB of physical RAM split into 512
frames. What...
asked 47 minutes ago