The batting average of a baseball player is the number of “hits” divided by the number of “at-bats.” Recently, a certain major league player’s at-bats and corresponding hits were recorded for 200 consecutive games. The consecutive games span more than one season. Since each game is different, the number of at-bats and hits both vary. For this particular player, there were from zero to five at-bats. Thus, one can sort the 200 games into six categories:
0 at-bats
1 at-bat
2 at-bats
3 at-bats
4 at-bats
5 at-bats
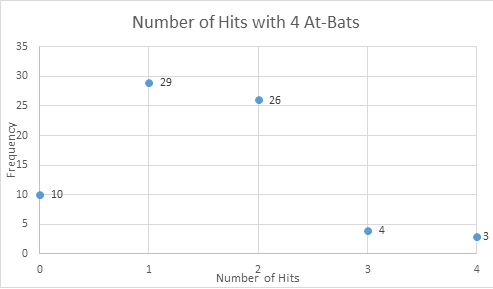
Consider the games where the player had exactly four at-bats. A similar analysis can be done for each of the other at-bats category. The scatter plot below is of the four at-bats number of hits versus frequency.
To compare the results to the Binomial Distribution, complete the following:
- Explain why the four at-bats is a binomial experiment.
- Using the Bats scatter plot, construct a frequency distribution for the number of hits.
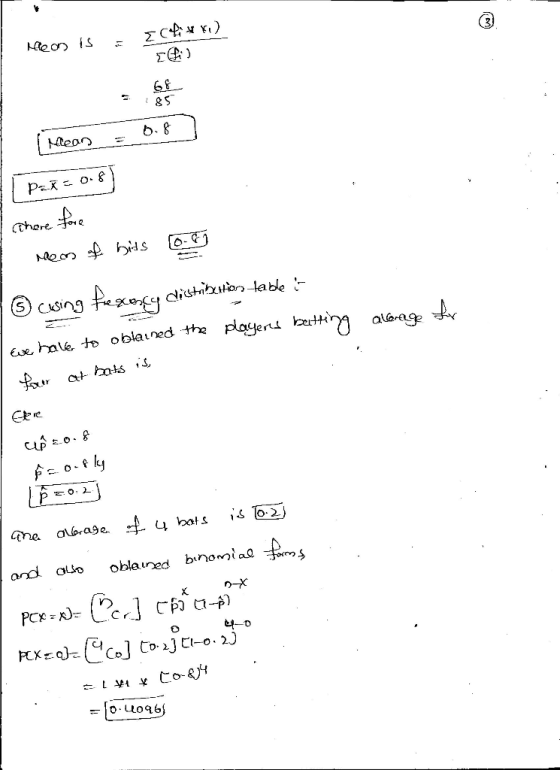
- Compute the mean number of hits. The formula for the mean is
.
Here, xi represent no. of hits (0, 1, 2, 3, 4) and fi is the corresponding frequency. Explain what the numerical result means. - From the frequency distribution, construct the corresponding
probability distribution. Explain why it is a probability
distribution. Then, use Excel to make a scatter plot of the
probability distribution:
Select the two columns of the probability distribution. Click on INSERT, and then go to the Charts area and select Scatter. Then choose the first Scatter chart (the one without lines connecting). - Using the frequency distribution, what is the player’s batting average for four at-bats? In part 3, note that the numerator in the formula for the mean is the total number of hits. The total number of at-bats is the denominator of the formula for the mean multiplied by 4.
- The Binomial Distribution is uniquely determined by n, the
number of trials, and p, the probability of “success” on each
trial. Using Excel, construct the Binomial Probability Distribution
for four trials, n, and probability of success, p, as the batting
average in part 5. Here is an explanation of the BINOM.DIST
function (Links to an external site.)Links to an external site. in
Excel.
For example, In Excel
=BINOM.DIST(7,15,0.7, FALSE)
represents the probability of 7 successes out of 15 (n) trials. The 0.7 is the probability of success, p. - Using the formula for the mean of the binomial distribution, what is the mean number of successes in part 6 up above?
- In Excel, make a scatter plot for the binomial distribution. The instructions for making one are in part 4 up above.
- Use the results up above to compare the probability distribution of four at bats and the Binomial Distribution. Compare the means in parts 4 and 6, too. If the probability distribution of 4 at bats and the Binomial Distribution differ, explain why that is so.
 .
.Homework Answers


 As HOMEWORKLIB RULES rule 4 bits
enough , i will not answer reaming bits.
As HOMEWORKLIB RULES rule 4 bits
enough , i will not answer reaming bits.
Please send the separate question , i will answer it .
thank you!
Add Answer to:
The batting average of a baseball player is the number of “hits” divided by the number of “at-bats.” Recently, a certain...
Option #1: Batting The batting average of a baseball player is the number of “hits” divided by the number of “at-bats.”...
Option #1: Batting The batting average of a baseball player is the number of “hits” divided by the number of “at-bats.” Recently, a certain major league player’s at-bats and corresponding hits were recorded for 200 consecutive games. The consecutive games span more than one season. Since each game is different, the number of at-bats and hits both vary. For this particular player, there were from zero to five at-bats. Thus, one can sort the 200 games into six categories: 0...
The success average of a hockey player is the number of “points scored” divided by the...
 The success average of a hockey player is the number of “points
scored” divided by the number of “shots on goal.” Recently, a
certain professional league player’s shots on goal and
corresponding points scored were recorded for 400 consecutive
games. The consecutive games span more than one season. Since each
game is different, the number of shots and points scored both vary.
For this particular player, there were from 0 to 15 shots. Thus,
one can sort the more than...
The success average of a hockey player is the number of “points
scored” divided by the number of “shots on goal.” Recently, a
certain professional league player’s shots on goal and
corresponding points scored were recorded for 400 consecutive
games. The consecutive games span more than one season. Since each
game is different, the number of shots and points scored both vary.
For this particular player, there were from 0 to 15 shots. Thus,
one can sort the more than...
4) A baseball player has a .300 batting average. Define H as the number of hits...
 4) A baseball player has a .300 batting average. Define H as the number of hits the batter gets in 4 at bats. a) What probability distribution does H follow? Give the name of the distribution and the value of its parameter(s) (2 points) b) Find the probability that the batter gets 3 hits in 4 at bats (1 point). c) Find the probability that the batter gets more than 1 hit in 4 at bats (1 point)
A baseball player, Mickey, who bats 310 (or .310) gets an average of 3.1 hits in...
A baseball player, Mickey, who bats 310 (or .310) gets an average of 3.1 hits in ten at bats. We will assume that each time Mickey bats he has a 0.31 probability of getting a hit. This means Mickeys at bats are independent from one another. If we also assume Mickey bats 5 times during a game and that x= the number of hits that Mickey gets then the following probability mass function, p(x), and cumulative distribution function F(x) are...
A high school baseball player has a 0.278 batting average. In one game, he gets 7...
 A high school baseball player has a 0.278 batting average. In one game, he gets 7 at bats. What is the probability he will get at least 2 hits in the game? (Round answer to 3 decimal places) A certain kind of sheet metal has, on average, 8 defects per 15 square feet. Assuming a Poisson distribution, find the probability that a 19 square foot metal sheet has at least 9 defects. Round your answer to three decimal places.
Mark noticed that the probability that a certain player hits a home run in a single...
Mark noticed that the probability that a certain player hits a home run in a single game is 0.175. Mark is interested in the variability of the number of home runs if this player plays 200 games. If Mark uses the normal approximation of the binomial distribution to model the number of home runs, what is the standard deviation for a total of 200 games? Answer choices are rounded to the hundredths place.
A high school baseball player has a 0.191 batting average. In one game, he gets 8...
 A high school baseball player has a 0.191 batting average. In one game, he gets 8 at bats. What is the probability he will get at least 6 hits in the game? Box 1: Enter your answer as an integer or decimal number. Examples: 3, 4, 5.5172 Enter DNE for Does Not Exist, oo for Infinity Submit License Question 14. Points possible: 1 Unlimited attempts. If a seed is planted, it has a 70% chance of growing into a healthy...
A baseball player has a pr=.12 chance of success on any given plate appearance
 Question 1 A baseball player has a pr=.12 chance of success on any given plate appearance Suppose the player has 3 independent plate appearances. What is the probability the player will make zero successes during the 3 independent plate appearances ? Round your answer to four decimal places.Question 2A softball player has a p= .29 chance of success on any given plate appearance Suppose the player has 4 independent plate appearances. What is the probability the player will make at least one success during the 4...
In the probability distribution to the? right, the random variable X represents the number of hits...
In the probability distribution to the? right, the random variable X represents the number of hits a baseball player obtained in a game over the course of a season. x P(x) 0 0.1665 1 0.3356 2 0.2873 3 0.1481 4 0.0366 5 0.0259 (1) Compute and interpret the mean of the random variable X. (2) Which of the following interpretations of the mean is? correct? A. In any number of? games, one would expect the mean number of hits per...
Number of Successes Frequency Relative Frequency 0 10 0.13889 1 29 0.40278 2 26 0.36111 3...
Number of Successes Frequency Relative Frequency 0 10 0.13889 1 29 0.40278 2 26 0.36111 3 4 0.05556 4 3 0.04167 Total 72 1.00 Mean of Successes 1.458 Using the frequency distribution, what is the tractor sales success average? In part 3, note that the numerator in the formula for the mean is the total number of successes. The total number of trials is the denominator of the formula for the mean multiplied by 4. What does this average mean?
 The success average of a hockey player is the number of “points
scored” divided by the number of “shots on goal.” Recently, a
certain professional league player’s shots on goal and
corresponding points scored were recorded for 400 consecutive
games. The consecutive games span more than one season. Since each
game is different, the number of shots and points scored both vary.
For this particular player, there were from 0 to 15 shots. Thus,
one can sort the more than...
The success average of a hockey player is the number of “points
scored” divided by the number of “shots on goal.” Recently, a
certain professional league player’s shots on goal and
corresponding points scored were recorded for 400 consecutive
games. The consecutive games span more than one season. Since each
game is different, the number of shots and points scored both vary.
For this particular player, there were from 0 to 15 shots. Thus,
one can sort the more than...
 4) A baseball player has a .300 batting average. Define H as the number of hits the batter gets in 4 at bats. a) What probability distribution does H follow? Give the name of the distribution and the value of its parameter(s) (2 points) b) Find the probability that the batter gets 3 hits in 4 at bats (1 point). c) Find the probability that the batter gets more than 1 hit in 4 at bats (1 point)
 A high school baseball player has a 0.278 batting average. In one game, he gets 7 at bats. What is the probability he will get at least 2 hits in the game? (Round answer to 3 decimal places) A certain kind of sheet metal has, on average, 8 defects per 15 square feet. Assuming a Poisson distribution, find the probability that a 19 square foot metal sheet has at least 9 defects. Round your answer to three decimal places.
 A high school baseball player has a 0.191 batting average. In one game, he gets 8 at bats. What is the probability he will get at least 6 hits in the game? Box 1: Enter your answer as an integer or decimal number. Examples: 3, 4, 5.5172 Enter DNE for Does Not Exist, oo for Infinity Submit License Question 14. Points possible: 1 Unlimited attempts. If a seed is planted, it has a 70% chance of growing into a healthy...
Most questions answered within 3 hours.
-
what are the differences between these?
a. shear force.
b. shear stress.
c. Bending Moment.
d....
asked 2 minutes ago -
The proportion of adult women in a certain geographical region
is approximately 51%. A marketing survey...
asked 9 minutes ago -
I am trying to answer a question that is asking why there was no
evidence of...
asked 20 minutes ago -
Power elecrtonics: buck converter?
Calculate and plot (via excel/MATLAB) the average V(out) of a
buck converter...
asked 21 minutes ago -
PLEASE USE PYTHON
training error should strictly decrease as the degree of the
hypothesis polynomials increases....
asked 26 minutes ago -
Using the Table and data below, create a procedure that accepts
product ID as a parameter...
asked 27 minutes ago -
Suppose X follows an exponential distribution with mean 7.5.
Determine the conditional probability P(x > 2.5...
asked 50 minutes ago -
Young softball batters are often instructed to “choke-up on the
bat” by their coach. In terms...
asked 54 minutes ago -
Suppose that you are an official with Mexico's economic
development agency. Write a one-page memo detailing...
asked 1 hour ago -
If you were an international firm, why would you support the
concept of global free trade?...
asked 1 hour ago -
Cisco packet tracer
Q1) Do you get any changes of IP address when packet is
traversing...
asked 2 hours ago -
What is the pressure inside a 33.0 L container holding 106.4 kg
of argon gas at...
asked 3 hours ago