An individual wanted to determine the relation that might exist between speed and miles per gallon...
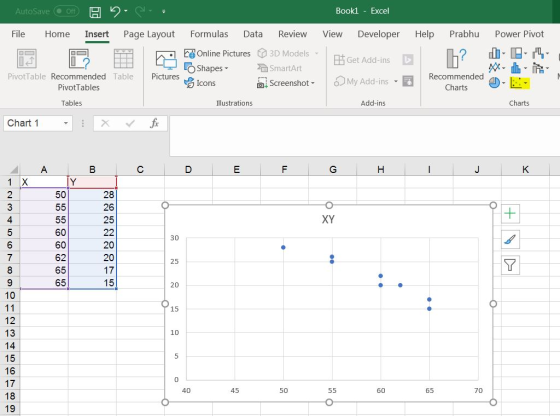
An individual wanted to determine the relation that might exist between speed and miles per gallon of an automobile. Let X be the average speed of a car on the highway measured in miles per hour and let Y represent the miles per gallon of the automobile. The following data is collected:
|
X |
50 |
55 |
55 |
60 |
60 |
62 |
65 |
65 |
|
Y |
28 |
26 |
25 |
22 |
20 |
20 |
17 |
15 |
a. In the space below, draw a scatterplot of the bivariate data set.
b. What is the value for r? Interpret this value, would you say that the correlation is positive or negative? Strong or Weak? How do you know?
c. From the regression equation given above, what value is the slope of the line? Interpret this slope, what does it tell us about the relationship between average speed and miles per gallon?
d. Predict the miles per gallon of a car traveling 63 miles per hour.
e. Predict the average speed of a car whose fuel mileage is 23 miles per gallon.
f. Find r squared. What does this statistic tell us about between average speed and miles per gallon?
Homework Answers
a. Scatter plot:
Bring data in to excel sheet. Select bot X and Y data set and go to data tab , choose scatterplot diagram.
b. r value
r value is nothing but correlation coefficient
r = -0.97
it is perfect negative correlation and weak

c. regression equation:
y = -0.8265x + 70.39
Select any data point in the chart and right click--> add trend line. choose "Linear" trend and select display an equation option

what value is the slope of the line?
y = -0.8265x + 70.39
this tells us if there is a relationship between the two variables. The scatter plot can show that a relationship can exist but not always prove that the variables are causing the other.
d. Predict the miles per gallon of a car traveling 63 miles per hour
y = -0.8265x + 70.39
x = 63
y = 18.3205
so 19 MPG is the predicted miles per gallon of a car traveling 63 miles per hour
Predict the average speed of a car whose fuel mileage is 23 miles per gallon.
Same way create scatterplot

y = -1.1419x + 83.693
=-1.1419*23+ 83.69 = 57.4293
58 MPG is the the average speed of a car whose fuel mileage is 23 miles per gallon.
Find r squared. What does this statistic tell us about between average speed and miles per gallon?
R-squared = 0.9438 = 0.94 (round to two decimal value)
This tells us how close the data are from fitting the regression line, which is also known as the coefficient of determination. It is the percentage of the response variable variation that is explained by the linear model.

Add Answer to:
An individual wanted to determine the relation that
might exist between speed and miles per gallon...
Problem 8 (18 points) An individual wanted to determine the relation that might exist between speed and miles per gallon of an automobile. Let Xbe the average speed of a car on the highway mea...
 Problem 8 (18 points) An individual wanted to determine the relation that might exist between speed and miles per gallon of an automobile. Let Xbe the average speed of a car on the highway measured in miles per hour andlet Y represent the miles per gallon of the automobile The following data is collected 50 28 60 62 20 65 26 25 20 17 d Predict the miles per gallon of a car traveling 63 miles per hour e Predict...
A department of transportation's study on driving speed and miles per gallon for midsize automobiles resulted...
 A department of transportation's study on driving speed and miles per gallon for midsize automobiles resulted in the following data: Speed (Miles per Hour) 30 50 40 55 30 24 60 24 51 56 Miles per Gallon 28 24 24 22 30 33 21 Compute the sample correlation coefficient (to 2 decimals and enter negative value as negative number). 35 26 24 What can you conclude, based on your computation of the sample correlation coefficient? - Select your answer -...
A department of transportation's study on driving speed and miles per gallon for midsize automobiles resulted...
 A department of transportation's study on driving speed and miles per gallon for midsize automobiles resulted in the following data: Speed (Miles per Hour) Miles per Gallon Compute the sample correlation coefficient (to 2 decimals and enter negative value as negative number) 29513955 2924 60 25 50 55 28 24 2523 303221 36 25 25 What can you conclude, based on your computation of the sample correlation coefficient? Select your answer Select the correct interpretation for the sample correlation coefficient....
The following data set shows the highest speed limit (miles/hour) and automobile fatality rate per 100...
The following data set shows the highest speed limit (miles/hour) and automobile fatality rate per 100 vehicle miles for 10 countries. Country Fatality Rate Speed Limit Norway 3.0 55 US 3.3 55 Finland 3.4 55 Britain 3.5 70 Denmark 4.1 55 Canada 4.3 60 Japan 4.7 55 Australia 4.9 65 Netherlands 5.1 60 Italy 6.1 75 Draw a scatterplot (10 pts) Calculate a Pearson r using the back of the page (20 pts) Describe the direction and magnitude of the...
A department of transportation's study on driving speed and miles per gallon for midsize automobiles resulted in t...
 A department of transportation's study on driving speed and miles per gallon for midsize automobiles resulted in the following data Speed (Miles per our30 50 40 55 30 24 60 25 51 55 Miles per Gallon 28 24 24 23 30 32 21 35 26 25 Compute the sample correlation coefficient (to 2 decimals and enter negative value as negative number) What can you conclude, based on your computation of the sample correlation coefficient? - Select your answer- Select the...
please provide the correct answer 1. As the speed (in miles per hour) of an automobile...
 please provide the correct answer
1. As the speed (in miles per hour) of an automobile increases, the gas mileage (in miles per gallon) first increases and then decreases. Suppose that this relationship is very regular, shown by the following data table and scatterplot. as Speed 30 40 50 60 70 Mileage 20 24 26 24 20 mileage 26 25 24 23 22 21 201 30 40 50 60 70 speed Why would we not want to compute a correlation...
please provide the correct answer
1. As the speed (in miles per hour) of an automobile increases, the gas mileage (in miles per gallon) first increases and then decreases. Suppose that this relationship is very regular, shown by the following data table and scatterplot. as Speed 30 40 50 60 70 Mileage 20 24 26 24 20 mileage 26 25 24 23 22 21 201 30 40 50 60 70 speed Why would we not want to compute a correlation...
The average gas mileage of a certain model car is 29 miles per gallon. If the...
The average gas mileage of a certain model car is 29 miles per gallon. If the gas mileages are normally distributed with a standard deviation of 2.4, find the probability that a car has a gas mileage of between 30 and 35 miles per gallon.
Your car gets 33 miles per gallon, you drive an average speed of 44 miles per hour
Your car gets 33 miles per gallon, you drive an average speed of 44 miles per hour. How much gas do you use in an hour?33/44? or 44/33
Gas mileage actually varies slightly with the driving speed of a car (as well as with...
 Gas mileage actually varies slightly with the driving speed of a car (as well as with highway vs. city driving). Suppose your car averages 31 miles per gallon on the highway if your average speed is 54 miles per hour, and it averages 29 miles per gallon on the highway if your average speed is 69 miles per hour. Answer parts (a) and (b) below. a. What is the driving time for a 3000-mile trip if you drive at an...
ASAP The speed of your automobile has a huge effect on fuel consumption. Traveling at 65...
 ASAP
The speed of your automobile has a huge effect on fuel consumption. Traveling at 65 miles per hour (mph) instead of 55 mph can consume almost 20% more fuel. As a general rule, for every mile per hour over 55, you lose 2% in fuel economy. For example, if your automobile gets 30 miles per gallon at 55 mph, the fuel consumption is 21 miles per gallon at 70 mph. If you take a 400-mile trip and your average...
ASAP
The speed of your automobile has a huge effect on fuel consumption. Traveling at 65 miles per hour (mph) instead of 55 mph can consume almost 20% more fuel. As a general rule, for every mile per hour over 55, you lose 2% in fuel economy. For example, if your automobile gets 30 miles per gallon at 55 mph, the fuel consumption is 21 miles per gallon at 70 mph. If you take a 400-mile trip and your average...
 Problem 8 (18 points) An individual wanted to determine the relation that might exist between speed and miles per gallon of an automobile. Let Xbe the average speed of a car on the highway measured in miles per hour andlet Y represent the miles per gallon of the automobile The following data is collected 50 28 60 62 20 65 26 25 20 17 d Predict the miles per gallon of a car traveling 63 miles per hour e Predict...
 A department of transportation's study on driving speed and miles per gallon for midsize automobiles resulted in the following data: Speed (Miles per Hour) 30 50 40 55 30 24 60 24 51 56 Miles per Gallon 28 24 24 22 30 33 21 Compute the sample correlation coefficient (to 2 decimals and enter negative value as negative number). 35 26 24 What can you conclude, based on your computation of the sample correlation coefficient? - Select your answer -...
 A department of transportation's study on driving speed and miles per gallon for midsize automobiles resulted in the following data: Speed (Miles per Hour) Miles per Gallon Compute the sample correlation coefficient (to 2 decimals and enter negative value as negative number) 29513955 2924 60 25 50 55 28 24 2523 303221 36 25 25 What can you conclude, based on your computation of the sample correlation coefficient? Select your answer Select the correct interpretation for the sample correlation coefficient....
 A department of transportation's study on driving speed and miles per gallon for midsize automobiles resulted in the following data Speed (Miles per our30 50 40 55 30 24 60 25 51 55 Miles per Gallon 28 24 24 23 30 32 21 35 26 25 Compute the sample correlation coefficient (to 2 decimals and enter negative value as negative number) What can you conclude, based on your computation of the sample correlation coefficient? - Select your answer- Select the...
 please provide the correct answer
1. As the speed (in miles per hour) of an automobile increases, the gas mileage (in miles per gallon) first increases and then decreases. Suppose that this relationship is very regular, shown by the following data table and scatterplot. as Speed 30 40 50 60 70 Mileage 20 24 26 24 20 mileage 26 25 24 23 22 21 201 30 40 50 60 70 speed Why would we not want to compute a correlation...
please provide the correct answer
1. As the speed (in miles per hour) of an automobile increases, the gas mileage (in miles per gallon) first increases and then decreases. Suppose that this relationship is very regular, shown by the following data table and scatterplot. as Speed 30 40 50 60 70 Mileage 20 24 26 24 20 mileage 26 25 24 23 22 21 201 30 40 50 60 70 speed Why would we not want to compute a correlation...
 Gas mileage actually varies slightly with the driving speed of a car (as well as with highway vs. city driving). Suppose your car averages 31 miles per gallon on the highway if your average speed is 54 miles per hour, and it averages 29 miles per gallon on the highway if your average speed is 69 miles per hour. Answer parts (a) and (b) below. a. What is the driving time for a 3000-mile trip if you drive at an...
 ASAP
The speed of your automobile has a huge effect on fuel consumption. Traveling at 65 miles per hour (mph) instead of 55 mph can consume almost 20% more fuel. As a general rule, for every mile per hour over 55, you lose 2% in fuel economy. For example, if your automobile gets 30 miles per gallon at 55 mph, the fuel consumption is 21 miles per gallon at 70 mph. If you take a 400-mile trip and your average...
ASAP
The speed of your automobile has a huge effect on fuel consumption. Traveling at 65 miles per hour (mph) instead of 55 mph can consume almost 20% more fuel. As a general rule, for every mile per hour over 55, you lose 2% in fuel economy. For example, if your automobile gets 30 miles per gallon at 55 mph, the fuel consumption is 21 miles per gallon at 70 mph. If you take a 400-mile trip and your average...
Most questions answered within 3 hours.
-
Executive Program Practical Connection Assignment
Subject : Operations Security.
Assignment:
Provide a reflection of at least...
asked 3 minutes ago -
Every time Casey is at bat he has a 0.4 probability of
getting on base (assume...
asked 11 minutes ago -
The Walston Company is to be liquidated and has the following
liabilities:
Income taxes
$
9,400...
asked 18 minutes ago -
If
the more comprehensive data is available in MEPS, why does the NHIS
still exist? How...
asked 39 minutes ago -
Koo argues that the Japanese economy in the 1990s suffered from
a balance sheet recession. What...
asked 32 minutes ago -
Automobile mechanics conduct diagnosis tests on 150 new cars of
particular make and model to determine...
asked 26 minutes ago -
11) Find the proceeds of a 5 year non-interest
bearing note for $6500 discounted 2.5 years...
asked 33 minutes ago -
Required: Prepare the consolidated financial statements of
Griffin Ltd at 30 June 2019.
Griffin Ltd is...
asked 42 minutes ago -
1.How large must the coefficient of static friction be between
the tires and the road if...
asked 57 minutes ago -
What is the time complexity (Big-O) of the following code?
class Main
{
// Recursive...
asked 57 minutes ago -
Economists look at any situation in terms of its component
parts: the people making decisions, the...
asked 1 hour ago -
What is a population?
Select one:
a. All of the individual organisms belonging to the same...
asked 1 hour ago