
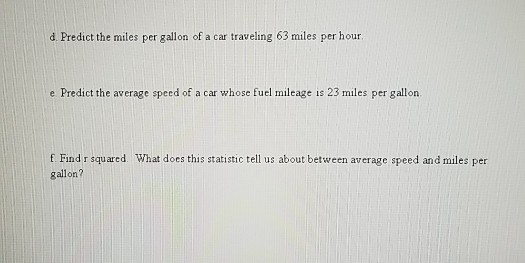
d Predict the miles per gallon of a car traveling 63 miles per hour e Predict the average speed of a car whose fuel mileage is 23 miles per gallon f Find r squared. What does this statistic tell us about between average speed and miles per gallon?
Homework Answers
We now draw up the following table for using method of least squares
|
Sr. No. |
x |
x2 |
y |
xy |
|
1 |
50 |
2500 |
28 |
1400 |
|
2 |
55 |
3025 |
26 |
1430 |
|
3 |
55 |
3025 |
25 |
1375 |
|
4 |
60 |
3600 |
22 |
1320 |
|
5 |
60 |
3600 |
20 |
1200 |
|
6 |
62 |
3844 |
20 |
1240 |
|
7 |
65 |
4225 |
17 |
1105 |
|
8 |
65 |
4225 |
15 |
975 |
|
N = 8 |
∑x=472 |
∑x2=28044 |
∑y=173 |
∑xy=10045 |
|
∑y = aN+b∑x 173 = 8a + 472b ……(i) |
∑xy = a∑x + b ∑x2 10045 =472a + 28044b …(ii) |
Solving (i) and (ii) we get,
a = 70.39 b = -0.826
now the line of regression of x on y is given as,
y = a + bx i.e. y = 70.39 – 0.826x
a. To find y at x = 63
Y = 70.39 – 0.826(63) = 18.352 mils/gal
b. To find x at y = 23
23 = 70.39 – 0.826x
x = 57.372 miles /hr
c. To find R2
|
x |
y |
(y-y*)2 |
y' |
(y-y’)2 |
|
50 |
28 |
40.64 |
29.09 |
55.73 |
|
55 |
26 |
19.14 |
24.96 |
11.12 |
|
55 |
25 |
11.39 |
24.96 |
11.12 |
|
60 |
22 |
0.14 |
20.83 |
0.63 |
|
60 |
20 |
2.64 |
20.83 |
0.63 |
|
62 |
20 |
2.64 |
19.18 |
5.99 |
|
65 |
17 |
21.39 |
16.70 |
24.26 |
|
65 |
15 |
43.89 |
16.70 |
24.26 |
|
Mean (y*) |
21.625 |
∑ = 141.88 |
∑ = 133.73 |
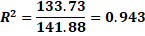
The value of R2indicates that the regression line matches very closely the actual observed values. i.e it is 94.3 % accurate
Add Answer to:
Problem 8 (18 points) An individual wanted to determine the relation that might exist between speed and miles per gallon of an automobile. Let Xbe the average speed of a car on the highway mea...
An individual wanted to determine the relation that might exist between speed and miles per gallon...
An individual wanted to determine the relation that might exist between speed and miles per gallon of an automobile. Let X be the average speed of a car on the highway measured in miles per hour and let Y represent the miles per gallon of the automobile. The following data is collected: X 50 55 55 60 60 62 65 65 Y 28 26 25 22 20 20 17 15 a. In the space below, draw a scatterplot of the...
Problem 1 (18 points) Suppose the distribution of fuel efficiency (miles per gallon (mpg) in highway...
 Problem 1 (18 points) Suppose the distribution of fuel efficiency (miles per gallon (mpg) in highway driving) for a sample of cars has a mound-shaped and symmetric distribution with mean X =38 and standard deviations 10 points. Illustrate your answers with graphs. a. Calculate the percent of cars whose fuel efficiency is less than 48 mpg. b. Calculate the percent of scores that are between 28 and 68 mpg. c. Calculate the 16th percentile of the data.
Problem 1 (18 points) Suppose the distribution of fuel efficiency (miles per gallon (mpg) in highway...
 Problem 1 (18 points) Suppose the distribution of fuel efficiency (miles per gallon (mpg) in highway driving) for a sample of cars has a mound-shaped and symmetric distribution with mean x =38 and standard deviation s = 10 points. Illustrate your answers with graphs. a. Calculate the percent of cars whose fuel efficiency is less than 48 mpg. b. Calculate the percent of scores that are between 28 and 68 mpg. c. Calculate the 16th percentile of the data.
8. An engineer wanted to determine how the weight of a car (a) Determine which variable...
 8. An engineer wanted to determine how the weight of a car (a) Determine which variable is the likely explanatory affects gas mileage. The following data represent the weight variable and which is the likely response variable. of various cars and their gas mileage. Complete parts (a) through (d). The explanatory variable is the miles Miles per per gallon and the response variable is Car Weight (pounds) Gallon the weight А 3310 19 The explanatory variable is the weight 3680...
 Problem 1 (18 points) Suppose the distribution of fuel efficiency (miles per gallon (mpg) in highway driving) for a sample of cars has a mound-shaped and symmetric distribution with mean X =38 and standard deviations 10 points. Illustrate your answers with graphs. a. Calculate the percent of cars whose fuel efficiency is less than 48 mpg. b. Calculate the percent of scores that are between 28 and 68 mpg. c. Calculate the 16th percentile of the data.
 Problem 1 (18 points) Suppose the distribution of fuel efficiency (miles per gallon (mpg) in highway driving) for a sample of cars has a mound-shaped and symmetric distribution with mean x =38 and standard deviation s = 10 points. Illustrate your answers with graphs. a. Calculate the percent of cars whose fuel efficiency is less than 48 mpg. b. Calculate the percent of scores that are between 28 and 68 mpg. c. Calculate the 16th percentile of the data.
 8. An engineer wanted to determine how the weight of a car (a) Determine which variable is the likely explanatory affects gas mileage. The following data represent the weight variable and which is the likely response variable. of various cars and their gas mileage. Complete parts (a) through (d). The explanatory variable is the miles Miles per per gallon and the response variable is Car Weight (pounds) Gallon the weight А 3310 19 The explanatory variable is the weight 3680...
Most questions answered within 3 hours.
-
You have a 825.3 mL sample of 2.754 M HA (Ka =
4.49⋅10−4). Calculate the pH...
asked 1 hour ago -
The blues made its way into many kinds of music. Eric Clapton,
The Beatles, and Elvis...
asked 3 hours ago -
8. A wave in a string has a wave function given by: y (x, t) =...
asked 2 hours ago -
If you’re standing at the bottom of a hill and asked to evaluate
it while being...
asked 4 hours ago -
1. Which region has taken the lead in the world of
e-waste handling?
a) European Union...
asked 4 hours ago -
A 8.15- g bullet from a 9-mm pistol has a velocity of 366.0 m/s.
It strikes...
asked 5 hours ago -
The outstanding bonds of Alpha Extracts have a yield to maturity
of 7.4 percent and a...
asked 5 hours ago -
The Problem: The Case of the Harmonizing Vacations
Your CEO is exploring partnering with a European...
asked 6 hours ago -
A chemical equation is balanced by adding coefficients in front
of some formulas so that the...
asked 6 hours ago -
From the literature (reference your sources): What are the
lattice parameters of calcite and aragonite? Why...
asked 7 hours ago -
Your system is rejecting the question am asking which is
preceded by a case study. It...
asked 7 hours ago -
3. On January 2, 2000, Larry creates a trust with himself as
trustee. Larry as trustee...
asked 7 hours ago