Calculate and interpret the z-scores using R. Using the mtcars dataset in R. To complete the...
Calculate and interpret the z-scores using R. Using the mtcars dataset in R. To complete the assignment, follow the steps below:
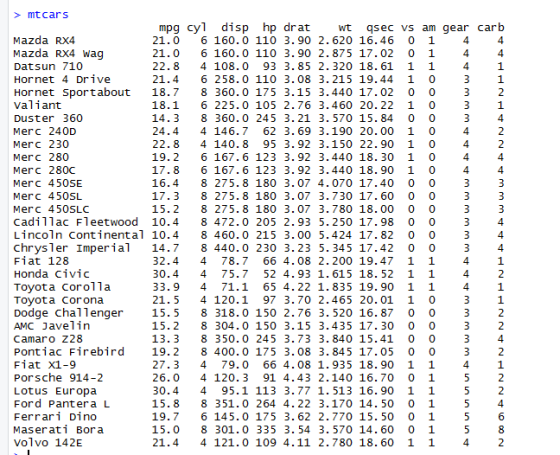
- In the R console, type mtcars. This shows the whole dataset.
- Using R, calculate the mean and standard deviation for the variables: mpg, cyl, disp, hp, drat, wt, qsec, gear, carb.
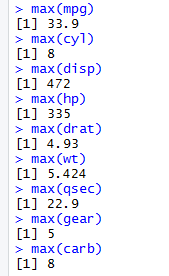
- Using R, calculate the maximum values for the same variables in (b).
- Using R, calculate the z-scores for the maximum values.
- Interpret each z-score in (d). Is the maximum value unusual? Explain why or why not.
Homework Answers
Whole dataset for
mtcars:
Calculate the mean and standard deviation for the variables : mpg,cyl,disp,hp,drat,wt,qsec,gear,carb
- First you need to attach all the variables to the mtcars dataset using attach function.
- To find mean use the function mean() and for standard deviation use sd().

Calculate the maximum values for the variables: mpg,cyl,disp,hp,drat,wt,qsec,gear,carb
- To find maximum value of a variable use max().

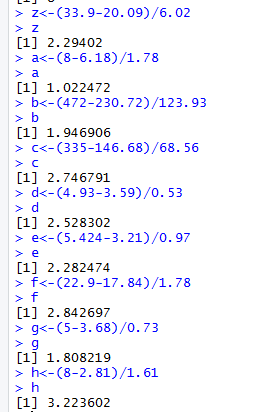
Calculate Z-score for the maximum values:
- Z-score is also called standard score. It is calculated from mean and standard deviation.
- To calculate Z-score of a particular value(X), the formula is

here  is mean of the
variable
is mean of the
variable
 is standard
deviation of the variable.
is standard
deviation of the variable.
- Z-score for maximum value of mpg:
here z-score value of maximum value of mpg is stored in 'z'
- Z-score for maximum value of cyl:
Z-score value is stored in 'a'
- Z-score for maximum value of disp:
Z-score value is stored in 'b'
- Z-score for maximum value of hp:
Z-score value is stored in 'c'
- Z-score for maximum value of drat:
Z-score value is stored in 'd'
- Z-score for maximum value of wt:
Z-score value is stored in 'e'
- Z-score for maximum value of qsec:
Z-score value is stored in 'f'
- Z-score for maximum value of gear:
Z-score value is stored in 'g'
- Z-score for maximum value of carb:
Z-score value is stored in 'h'
- We have already calculated mean,standard deviation and maximum values so you can directly calculate z-score value. and store it in different variables.

Interpreting each Z-score for each variable:
- The z-score value for maximum value of mpg is 2.29402.
It means the car which is having maximum value of mpg are having nearly 2.30 standard deviations from the mean of mpg.
- The z-score value for maximum value of cyl is 1.022
It means the car which is having maximum value of cyl are having 1.022 standard deviations from the mean of cyl.
- The z-score value for maximum value of disp is 1.94.
It means the car which is having maximum value of disp are having nearly 2 standard deviations from the mean of disp.
- The z-score value for maximum value of hp is 2.74.
It means the car which is having maximum value of hp are having 2.74 standard deviations from the mean of hp.
- The z-score value for maximum value of drat is 2.52.
It means the car which is having maximum value of drat are having nearly 2.52 standard deviations from the mean of drat.
- The z-score value for maximum value of wt is 2.28
It means the car which is having maximum value of wt are having nearly 2.30 standard deviations from the mean of wt.
- The z-score value for maximum value of qsec is 2.84
It means the car which is having maximum value of qsec are having nearly 2.84 standard deviations from the mean of qsec.
- The z-score value for maximum value of gear is 1.80
It means the car which is having maximum value of gear are having nearly 1.80 standard deviations from the mean of gear.
- The z-score value for maximum value of carb is 3.22
It means the car which is having maximum value of carb are having nearly 3.22 standard deviations from the mean of carb.
Is the maximum value unusual?
Yes the maximum values are different because different cars will have different values based on quality and quantity.
For example, duster 360 is having maximum cyl value but its am is having minimum value.
Whole dataset for
mtcars:

Calculate the mean and standard deviation for the variables : mpg,cyl,disp,hp,drat,wt,qsec,gear,carb
- First you need to attach all the variables to the mtcars dataset using attach function.
- To find mean use the function mean() and for standard deviation use sd().

Calculate the maximum values for the variables: mpg,cyl,disp,hp,drat,wt,qsec,gear,carb
- To find maximum value of a variable use max().
Calculate Z-score for the maximum values:
- Z-score is also called standard score. It is calculated from mean and standard deviation.
- To calculate Z-score of a particular value(X), the formula is

here  is mean of the
variable
is mean of the
variable
 is standard
deviation of the variable.
is standard
deviation of the variable.
- Z-score for maximum value of mpg:
here z-score value of maximum value of mpg is stored in 'z'
- Z-score for maximum value of cyl:
Z-score value is stored in 'a'
- Z-score for maximum value of disp:
Z-score value is stored in 'b'
- Z-score for maximum value of hp:
Z-score value is stored in 'c'
- Z-score for maximum value of drat:
Z-score value is stored in 'd'
- Z-score for maximum value of wt:
Z-score value is stored in 'e'
- Z-score for maximum value of qsec:
Z-score value is stored in 'f'
- Z-score for maximum value of gear:
Z-score value is stored in 'g'
- Z-score for maximum value of carb:
Z-score value is stored in 'h'
- We have already calculated mean,standard deviation and maximum values so you can directly calculate z-score value. and store it in different variables.
Interpreting each Z-score for each variable:
- The z-score value for maximum value of mpg is 2.29402.
It means the car which is having maximum value of mpg are having nearly 2.30 standard deviations from the mean of mpg.
- The z-score value for maximum value of cyl is 1.022
It means the car which is having maximum value of cyl are having 1.022 standard deviations from the mean of cyl.
- The z-score value for maximum value of disp is 1.94.
It means the car which is having maximum value of disp are having nearly 2 standard deviations from the mean of disp.
- The z-score value for maximum value of hp is 2.74.
It means the car which is having maximum value of hp are having 2.74 standard deviations from the mean of hp.
- The z-score value for maximum value of drat is 2.52.
It means the car which is having maximum value of drat are having nearly 2.52 standard deviations from the mean of drat.
- The z-score value for maximum value of wt is 2.28
It means the car which is having maximum value of wt are having nearly 2.30 standard deviations from the mean of wt.
- The z-score value for maximum value of qsec is 2.84
It means the car which is having maximum value of qsec are having nearly 2.84 standard deviations from the mean of qsec.
- The z-score value for maximum value of gear is 1.80
It means the car which is having maximum value of gear are having nearly 1.80 standard deviations from the mean of gear.
- The z-score value for maximum value of carb is 3.22
It means the car which is having maximum value of carb are having nearly 3.22 standard deviations from the mean of carb.
Is the maximum value unusual?
Yes the maximum values are different because different cars will have different values based on quality and quantity.
For example, duster 360 is having maximum cyl value but its am is having minimum value.
Whole dataset for
mtcars:

Calculate the mean and standard deviation for the variables : mpg,cyl,disp,hp,drat,wt,qsec,gear,carb
- First you need to attach all the variables to the mtcars dataset using attach function.
- To find mean use the function mean() and for standard deviation use sd().

Calculate the maximum values for the variables: mpg,cyl,disp,hp,drat,wt,qsec,gear,carb
- To find maximum value of a variable use max().

Calculate Z-score for the maximum values:
- Z-score is also called standard score. It is calculated from mean and standard deviation.
- To calculate Z-score of a particular value(X), the formula is

here  is mean of the
variable
is mean of the
variable
 is standard
deviation of the variable.
is standard
deviation of the variable.
- Z-score for maximum value of mpg:
here z-score value of maximum value of mpg is stored in 'z'
- Z-score for maximum value of cyl:
Z-score value is stored in 'a'
- Z-score for maximum value of disp:
Z-score value is stored in 'b'
- Z-score for maximum value of hp:
Z-score value is stored in 'c'
- Z-score for maximum value of drat:
Z-score value is stored in 'd'
- Z-score for maximum value of wt:
Z-score value is stored in 'e'
- Z-score for maximum value of qsec:
Z-score value is stored in 'f'
- Z-score for maximum value of gear:
Z-score value is stored in 'g'
- Z-score for maximum value of carb:
Z-score value is stored in 'h'
- We have already calculated mean,standard deviation and maximum values so you can directly calculate z-score value. and store it in different variables.

Interpreting each Z-score for each variable:
- The z-score value for maximum value of mpg is 2.29402.
It means the car which is having maximum value of mpg are having nearly 2.30 standard deviations from the mean of mpg.
- The z-score value for maximum value of cyl is 1.022
It means the car which is having maximum value of cyl are having 1.022 standard deviations from the mean of cyl.
- The z-score value for maximum value of disp is 1.94.
It means the car which is having maximum value of disp are having nearly 2 standard deviations from the mean of disp.
- The z-score value for maximum value of hp is 2.74.
It means the car which is having maximum value of hp are having 2.74 standard deviations from the mean of hp.
- The z-score value for maximum value of drat is 2.52.
It means the car which is having maximum value of drat are having nearly 2.52 standard deviations from the mean of drat.
- The z-score value for maximum value of wt is 2.28
It means the car which is having maximum value of wt are having nearly 2.30 standard deviations from the mean of wt.
- The z-score value for maximum value of qsec is 2.84
It means the car which is having maximum value of qsec are having nearly 2.84 standard deviations from the mean of qsec.
- The z-score value for maximum value of gear is 1.80
It means the car which is having maximum value of gear are having nearly 1.80 standard deviations from the mean of gear.
- The z-score value for maximum value of carb is 3.22
It means the car which is having maximum value of carb are having nearly 3.22 standard deviations from the mean of carb.
Is the maximum value unusual?
Yes the maximum values are different because different cars will have different values based on quality and quantity.
For example, duster 360 is having maximum cyl value but its am is having minimum value.
Add Answer to:
Calculate and interpret the z-scores using R. Using the
mtcars dataset in R. To complete the...
The data set "mtcars" in R has 11 variables with 32 observations. A data frame with...
 The data set "mtcars" in R has 11 variables with 32 observations. A data frame with 32 observations on 11 variables. [, 1] mpg Miles/(US) gallon [, 2] cyl Number of cylinders [, 3] disp Displacement (cu.in.) [, 4] hp Gross horsepower [, 5] drat Rear axle ratio [, 6] wt Weight (1000 lbs) [, 7] qsec 1/4 mile time [, 8] vs V/S [, 9) am Transmission (0 = automatic, 1 = manual) [,10] gear Number of forward gears...
The Motor Trend Car Road Tests dataset mtcars, in faraway R package, was extracted from the...
The Motor Trend Car Road Tests dataset mtcars, in faraway R package, was extracted from the 1974 Motor Trend US magazine, and comprises fuel consumption and 10 aspects of automobile design and performance for 32 automobiles (1973–74 models). The data frame has 32 observation on 11 (numeric) variables: mpg: Miles/(US) gallon; cyl: Number of cylinders; disp: Displacement (cu.in.); hp: Gross horsepower; drat: Rear axle ratio; wt: Weight (1000 lbs); qsec: 1/4 mile time; vs: Engine (0 = V-shaped, 1 =...
1. For each of the following regression models, write down the X matrix and 3 vector....
 1. For each of the following regression models, write down the X matrix and 3 vector. Assume in both cases that there are four observations (a) Y BoB1X1 + B2X1X2 (b) log Y Bo B1XiB2X2+ 2. For each of the following regression models, write down the X matrix and vector. Assume in both cases that there are five observations. (a) YB1XB2X2+BXE (b) VYBoB, X,a +2 log10 X2+E regression model never reduces R2, why 3. If adding predictor variables to a...
Answer the following question by showing the codes in R 2. Consider the dataset mtcars and...
 Answer the following question by showing the codes in R
2. Consider the dataset mtcars and suppose we are interested in modeling the mpg of a vehicle based on a single variable presented in the dataset. a) Use the cor ) function in R, apply it to only numerical variables in the dataset. Identify the numerical variable that shows the most significant correlation, and generate a scatterplot between this variable and mpg. b) Use the 1m() function in R to...
Answer the following question by showing the codes in R
2. Consider the dataset mtcars and suppose we are interested in modeling the mpg of a vehicle based on a single variable presented in the dataset. a) Use the cor ) function in R, apply it to only numerical variables in the dataset. Identify the numerical variable that shows the most significant correlation, and generate a scatterplot between this variable and mpg. b) Use the 1m() function in R to...
The Book of R (Question 20.2) Please answer using R code. Continue using the survey data...
The Book of R (Question 20.2) Please answer using R code. Continue using the survey data frame from the package MASS for the next few exercises. The survey data set has a variable named Exer , a factor with k = 3 levels describing the amount of physical exercise time each student gets: none, some, or frequent. Obtain a count of the number of students in each category and produce side-by-side boxplots of student height split by exercise. Assuming independence...
The data file Motor Trend is a random sample of 32 automobiles. The miles per gallon ...
The data file Motor Trend is a random sample of 32 automobiles. The miles per gallon (mpg), weight (wt), horsepower (hp) and type of transmission (manual or automatic) is recorded for each sampled automobile. The file is available on Blackboard. Transmission is a categorical variable. Code the variable transmission so that it can be used in a regression model. Your coding should assign a 1 to manual transmission and a 0 to automatic. Develop a regression model with mpg as...
The built-in R dataset swiss gives Standardized fertility measure and socio-economic indicators for each of 47...
The built-in R dataset swiss gives Standardized fertility measure and socio-economic indicators for each of 47 French-speaking provinces of Switzerland at about 1888. The dataset is a data frame containing 6 columns (variables). The column Infant.Mortality represents the average number of live births who live less than 1 year over a 3-year period. We are interested in the Infant.Mortality column. We can convert the data in this colun to an ordinary vector x by making the assignment x <- swiss$Infant.Mortality....
Problem 4: Variables that may affect Grades The data set contains a random sample of STAT 250 Final Exam Scores out of 80 points. For each individual sampled, the time (in hours per week) that the stu...
Problem 4: Variables that may affect Grades The data set contains a random sample of STAT 250 Final Exam Scores out of 80 points. For each individual sampled, the time (in hours per week) that the student spent participating in a GMU club or sport and working for pay outside of GMU was recorded. Values of 0 indicate the students either does not participate in a club or sport or does not work a job for pay. The goal of...
Write solutions legibly, and show all work. Walk the reader through your thought process, using English...
Write solutions legibly, and show all work. Walk the reader through your thought process, using English words when necessary. 1. Recall question 2 of the previous homework – We draw 6 cards from a 52 card deck and let X = the number of heart cards drawn. You already found the pmf back then. You’re allowed to use it here without re-deriving it. a. What is the expected value of X? b. What is the variance of X? What is...
i need help on question 3 to 22 please. Midterm ex review. MATH 101 Use the...
 i need help on question 3 to 22 please.
Midterm ex review. MATH 101 Use the following information to answer the next four exercises. The midterm grades on a chemistry exam, graded on a scale of 0 to 100, were: 62, 64, 65, 65, 68, 70, 72, 72, 74, 75, 75, 75, 76,78, 78, 81, 82, 83, 84, 85, 87, 88, 92, 95, 98, 98, 100, 100,740 1. Do you see any outliers in this data? If so, how would...
i need help on question 3 to 22 please.
Midterm ex review. MATH 101 Use the following information to answer the next four exercises. The midterm grades on a chemistry exam, graded on a scale of 0 to 100, were: 62, 64, 65, 65, 68, 70, 72, 72, 74, 75, 75, 75, 76,78, 78, 81, 82, 83, 84, 85, 87, 88, 92, 95, 98, 98, 100, 100,740 1. Do you see any outliers in this data? If so, how would...
 The data set "mtcars" in R has 11 variables with 32 observations. A data frame with 32 observations on 11 variables. [, 1] mpg Miles/(US) gallon [, 2] cyl Number of cylinders [, 3] disp Displacement (cu.in.) [, 4] hp Gross horsepower [, 5] drat Rear axle ratio [, 6] wt Weight (1000 lbs) [, 7] qsec 1/4 mile time [, 8] vs V/S [, 9) am Transmission (0 = automatic, 1 = manual) [,10] gear Number of forward gears...
 1. For each of the following regression models, write down the X matrix and 3 vector. Assume in both cases that there are four observations (a) Y BoB1X1 + B2X1X2 (b) log Y Bo B1XiB2X2+ 2. For each of the following regression models, write down the X matrix and vector. Assume in both cases that there are five observations. (a) YB1XB2X2+BXE (b) VYBoB, X,a +2 log10 X2+E regression model never reduces R2, why 3. If adding predictor variables to a...
 Answer the following question by showing the codes in R
2. Consider the dataset mtcars and suppose we are interested in modeling the mpg of a vehicle based on a single variable presented in the dataset. a) Use the cor ) function in R, apply it to only numerical variables in the dataset. Identify the numerical variable that shows the most significant correlation, and generate a scatterplot between this variable and mpg. b) Use the 1m() function in R to...
Answer the following question by showing the codes in R
2. Consider the dataset mtcars and suppose we are interested in modeling the mpg of a vehicle based on a single variable presented in the dataset. a) Use the cor ) function in R, apply it to only numerical variables in the dataset. Identify the numerical variable that shows the most significant correlation, and generate a scatterplot between this variable and mpg. b) Use the 1m() function in R to...
 i need help on question 3 to 22 please.
Midterm ex review. MATH 101 Use the following information to answer the next four exercises. The midterm grades on a chemistry exam, graded on a scale of 0 to 100, were: 62, 64, 65, 65, 68, 70, 72, 72, 74, 75, 75, 75, 76,78, 78, 81, 82, 83, 84, 85, 87, 88, 92, 95, 98, 98, 100, 100,740 1. Do you see any outliers in this data? If so, how would...
i need help on question 3 to 22 please.
Midterm ex review. MATH 101 Use the following information to answer the next four exercises. The midterm grades on a chemistry exam, graded on a scale of 0 to 100, were: 62, 64, 65, 65, 68, 70, 72, 72, 74, 75, 75, 75, 76,78, 78, 81, 82, 83, 84, 85, 87, 88, 92, 95, 98, 98, 100, 100,740 1. Do you see any outliers in this data? If so, how would...
Most questions answered within 3 hours.
-
Humans have used horses for transportation for millions of
years. Therefore, they will use horses for...
asked 1 hour ago -
The following are the Jensen Corporation's unit costs of making
and selling an item at a...
asked 1 hour ago -
Does direct Medicare reimbursement of Advanced practice nurses
increase access to their services?
asked 2 hours ago -
List and explain why a company would choose to use a
published
compensation survey vs. creating...
asked 2 hours ago -
A discrete random variable X can take values from 1 to 10. Find
the variance of...
asked 3 hours ago -
The primary financial goal of a corporation is to maximize:
shareholders wealth.
earnings per share.
stock...
asked 3 hours ago -
determine whether the vectors u=(1,2,3,), v=(-2,1,0) and
w=(1,0,1) are linearly dependent or independent.
asked 3 hours ago -
python
Define a function called print_values which takes a dictionary
object as a parameter. The function...
asked 4 hours ago -
In Chapter 1 you created a program named Triangle in
which you displayed a seven-line triangle...
asked 4 hours ago -
Research question: What are the differences between separately
stated and non separately stated transactions in an...
asked 4 hours ago -
By using Arduino write a code that connects two LEDs to two
push-buttons. Each button controls...
asked 5 hours ago -
Bank of America has bonds that pay a coupon interest rate of 5.5
percent and mature...
asked 6 hours ago