x(n)=2cos((pie/4)n)+cos((3*pie/4)n) implement in matlab the filtering problem
Homework Answers

clear all
clc
%% samples duration
n=0:1:100;
%% Input signal generation
x = 2*cos((pi/4).*n) + cos((3*pi/4).*n);
%% plot the response
figure(1)
stem(n,x)
grid on
xlabel('n')
ylabel('x[n]')
title('Discrete signal response')
%% band pass filter design
order = 6;
f_lc = 0.2; % lower cutoff
f_hc = 0.6; % higher cutoff
%% design the filter
[b,a] = butter(order,f_lc/(f_hc/2));
freqz(b,a)
%% filtering response
y = filter(b,a,x);
%% plot the output response
figure(2)
stem(n,y)
grid on
xlabel('n')
ylabel('y[n]')
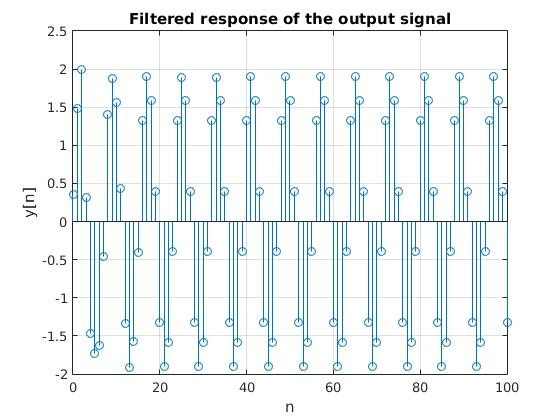
title('Filtered response of the output signal')
The original signal response is shown below

The filter response is shown below

The filtered signal response is shown below
Add Answer to:
x(n)=2cos((pie/4)n)+cos((3*pie/4)n)
implement in matlab the filtering problem
d=2cos(pie/3)t solve for t
d=2cos(pie/3)t solve for t
(USING MATLAB) Given two differential equations X= sin(t)(exp(cos(t))-2cos(4t)+sin(t/12)^5) And Y = cos(t)(exp(cos(t))-2cos(4t)+sin(t/12)^5) where 0<t<20pi is a...
(USING MATLAB) Given two differential equations X= sin(t)(exp(cos(t))-2cos(4t)+sin(t/12)^5) And Y = cos(t)(exp(cos(t))-2cos(4t)+sin(t/12)^5) where 0<t<20pi is a vector of 5000 points created by using (linspace) command : Write script to plot X and Y with red color ?
5. By using Fresnel method find f(x)where f(x) = 4 cos(2x) + 3 cos (2x + 2) + 2cos(2-2) 6 Coneide...
 5. By using Fresnel method find f(x)where f(x) = 4 cos(2x) + 3 cos (2x + 2) + 2cos(2-2) 6 Coneider 75 re crte choum in the iouro2 Thie crnte I
5. By using Fresnel method find f(x)where f(x) = 4 cos(2x) + 3 cos (2x + 2) + 2cos(2-2) 6 Coneider 75 re crte choum in the iouro2 Thie crnte I
5. By using Fresnel method find f(x)where f(x) = 4 cos(2x) + 3 cos (2x + 2) + 2cos(2-2) 6 Coneider 75 re crte choum in the iouro2 Thie crnte I
consider the signal using matlab Problem 2: Consider a signal: x[n] 3cos(n7/3) + 2sin(nt/4)+ cos(n7/5) Using...
 consider the signal using matlab
Problem 2: Consider a signal: x[n] 3cos(n7/3) + 2sin(nt/4)+ cos(n7/5) Using Matlab, (1) Plot this signal in time domain. Can you identify the various frequencies in this signal? Use n 0:1:1000 (2) Plot this signal in frequency domain using the "fft" command. Identify the individual frequencies in the plot. (3) Calculate the frequencies of these signals. In the frequency plot, 1000 2
consider the signal using matlab
Problem 2: Consider a signal: x[n] 3cos(n7/3) + 2sin(nt/4)+ cos(n7/5) Using Matlab, (1) Plot this signal in time domain. Can you identify the various frequencies in this signal? Use n 0:1:1000 (2) Plot this signal in frequency domain using the "fft" command. Identify the individual frequencies in the plot. (3) Calculate the frequencies of these signals. In the frequency plot, 1000 2
la. Determine the fundamental period of signal x[n] = cos? Con Hints: i. 2cos? (0) =...
 la. Determine the fundamental period of signal x[n] = cos? Con Hints: i. 2cos? (0) = 1 + cos(20) ii. Period of a constant real number =1.
** INCLUDE MATLAB CODE ** Use MATLAB® to implement and plot the discrete fourier transform (DFT)...
** INCLUDE MATLAB CODE ** Use MATLAB® to implement and plot the discrete fourier transform (DFT) for the following waveform: x(t) = 5 + 2cos(2*pi*t – pi/2) + 3cos(2*pi*4*t)
3. The signal continuous time signal re(t)-cos(200t)2cos cos(100t) is sampled at twice the Nyquis...
 3. The signal continuous time signal re(t)-cos(200t)2cos cos(100t) is sampled at twice the Nyquist rate to get the sequence r[n]. (a) Sketch X(e) (b) If y[n] = [4n]. Sketch Y(e'"). (c) Is there any aliasing in the Fourier spectrum of yin]? Why or Why Not? (d) If z [n] = x-1, ketch the DTFT of z[n] (e) Is there any aliasing in the Fourier spectrum of [n]? Why or Why Not?
3. The signal continuous time signal re(t)-cos(200t)2cos cos(100t) is...
3. The signal continuous time signal re(t)-cos(200t)2cos cos(100t) is sampled at twice the Nyquist rate to get the sequence r[n]. (a) Sketch X(e) (b) If y[n] = [4n]. Sketch Y(e'"). (c) Is there any aliasing in the Fourier spectrum of yin]? Why or Why Not? (d) If z [n] = x-1, ketch the DTFT of z[n] (e) Is there any aliasing in the Fourier spectrum of [n]? Why or Why Not?
3. The signal continuous time signal re(t)-cos(200t)2cos cos(100t) is...
4. Given a modulating signal m(t) = 2cos (100nt) + 2cos (250nt) + 2sin (100nt) is...
 4. Given a modulating signal m(t) = 2cos (100nt) + 2cos (250nt) + 2sin (100nt) is modulated using AM SSB-SC using fe at 1000 Hz. (a) Draw by hand, the magnitude spectra of the modulated signal, retaining the Lower Sidebands, for the appropriate frequency range in Hz. (4) (b) Diagram and explain the demodulation and filtering process to retrieve m(t). (4) (c) What must be modified in the modulation and demodulation processes if you were to implement AM VSB vs....
The answer from problem 15 is --> cos(2π/5) = 2cos^2(π/5) -1 16. In your answer in problem 15 make the substitution x = cos and solve the quadratic equation for x. 16. In your answer in pro...
 The answer from problem 15 is --> cos(2π/5) =
2cos^2(π/5) -1
16. In your answer in problem 15 make the substitution x = cos and solve the quadratic equation for x.
16. In your answer in problem 15 make the substitution x = cos and solve the quadratic equation for x.
The answer from problem 15 is --> cos(2π/5) =
2cos^2(π/5) -1
16. In your answer in problem 15 make the substitution x = cos and solve the quadratic equation for x.
16. In your answer in problem 15 make the substitution x = cos and solve the quadratic equation for x.
for the plot, provide the matlab code. 3. Let the input signal x[n] (defined for -<n...
 for the plot, provide the matlab code.
3. Let the input signal x[n] (defined for -<n < oo) to the system be x[n] = 3 cos( 0.05πn) + 4 cos( 0.45πn) + cos( 0.95 n) and the transfer function be 1-re-je a) Plot this signal as a function of n. b) Determine and plot the output y[n] produced by the system due to the input analyzed in part a) of this problem. Do this first with r 0.05 and then...
for the plot, provide the matlab code.
3. Let the input signal x[n] (defined for -<n < oo) to the system be x[n] = 3 cos( 0.05πn) + 4 cos( 0.45πn) + cos( 0.95 n) and the transfer function be 1-re-je a) Plot this signal as a function of n. b) Determine and plot the output y[n] produced by the system due to the input analyzed in part a) of this problem. Do this first with r 0.05 and then...
 5. By using Fresnel method find f(x)where f(x) = 4 cos(2x) + 3 cos (2x + 2) + 2cos(2-2) 6 Coneider 75 re crte choum in the iouro2 Thie crnte I
5. By using Fresnel method find f(x)where f(x) = 4 cos(2x) + 3 cos (2x + 2) + 2cos(2-2) 6 Coneider 75 re crte choum in the iouro2 Thie crnte I
5. By using Fresnel method find f(x)where f(x) = 4 cos(2x) + 3 cos (2x + 2) + 2cos(2-2) 6 Coneider 75 re crte choum in the iouro2 Thie crnte I
 consider the signal using matlab
Problem 2: Consider a signal: x[n] 3cos(n7/3) + 2sin(nt/4)+ cos(n7/5) Using Matlab, (1) Plot this signal in time domain. Can you identify the various frequencies in this signal? Use n 0:1:1000 (2) Plot this signal in frequency domain using the "fft" command. Identify the individual frequencies in the plot. (3) Calculate the frequencies of these signals. In the frequency plot, 1000 2
consider the signal using matlab
Problem 2: Consider a signal: x[n] 3cos(n7/3) + 2sin(nt/4)+ cos(n7/5) Using Matlab, (1) Plot this signal in time domain. Can you identify the various frequencies in this signal? Use n 0:1:1000 (2) Plot this signal in frequency domain using the "fft" command. Identify the individual frequencies in the plot. (3) Calculate the frequencies of these signals. In the frequency plot, 1000 2
 la. Determine the fundamental period of signal x[n] = cos? Con Hints: i. 2cos? (0) = 1 + cos(20) ii. Period of a constant real number =1.
 3. The signal continuous time signal re(t)-cos(200t)2cos cos(100t) is sampled at twice the Nyquist rate to get the sequence r[n]. (a) Sketch X(e) (b) If y[n] = [4n]. Sketch Y(e'"). (c) Is there any aliasing in the Fourier spectrum of yin]? Why or Why Not? (d) If z [n] = x-1, ketch the DTFT of z[n] (e) Is there any aliasing in the Fourier spectrum of [n]? Why or Why Not?
3. The signal continuous time signal re(t)-cos(200t)2cos cos(100t) is...
3. The signal continuous time signal re(t)-cos(200t)2cos cos(100t) is sampled at twice the Nyquist rate to get the sequence r[n]. (a) Sketch X(e) (b) If y[n] = [4n]. Sketch Y(e'"). (c) Is there any aliasing in the Fourier spectrum of yin]? Why or Why Not? (d) If z [n] = x-1, ketch the DTFT of z[n] (e) Is there any aliasing in the Fourier spectrum of [n]? Why or Why Not?
3. The signal continuous time signal re(t)-cos(200t)2cos cos(100t) is...
 4. Given a modulating signal m(t) = 2cos (100nt) + 2cos (250nt) + 2sin (100nt) is modulated using AM SSB-SC using fe at 1000 Hz. (a) Draw by hand, the magnitude spectra of the modulated signal, retaining the Lower Sidebands, for the appropriate frequency range in Hz. (4) (b) Diagram and explain the demodulation and filtering process to retrieve m(t). (4) (c) What must be modified in the modulation and demodulation processes if you were to implement AM VSB vs....
 The answer from problem 15 is --> cos(2π/5) =
2cos^2(π/5) -1
16. In your answer in problem 15 make the substitution x = cos and solve the quadratic equation for x.
16. In your answer in problem 15 make the substitution x = cos and solve the quadratic equation for x.
The answer from problem 15 is --> cos(2π/5) =
2cos^2(π/5) -1
16. In your answer in problem 15 make the substitution x = cos and solve the quadratic equation for x.
16. In your answer in problem 15 make the substitution x = cos and solve the quadratic equation for x.
 for the plot, provide the matlab code.
3. Let the input signal x[n] (defined for -<n < oo) to the system be x[n] = 3 cos( 0.05πn) + 4 cos( 0.45πn) + cos( 0.95 n) and the transfer function be 1-re-je a) Plot this signal as a function of n. b) Determine and plot the output y[n] produced by the system due to the input analyzed in part a) of this problem. Do this first with r 0.05 and then...
for the plot, provide the matlab code.
3. Let the input signal x[n] (defined for -<n < oo) to the system be x[n] = 3 cos( 0.05πn) + 4 cos( 0.45πn) + cos( 0.95 n) and the transfer function be 1-re-je a) Plot this signal as a function of n. b) Determine and plot the output y[n] produced by the system due to the input analyzed in part a) of this problem. Do this first with r 0.05 and then...
Most questions answered within 3 hours.
-
Suppose a university advertises that its average class size is
31 or less. A student organization...
asked 8 minutes ago -
Draw the octahedral field electron configuration of Cd2+
asked 5 minutes ago -
According to secret company tests, the highway gas mileage that
Urbana trucks manufactured in Germany get...
asked 5 minutes ago -
A recruiting firm finds that 20% of the applicants for a
particularsales position are fluent in...
asked 10 minutes ago -
A solute with a retention time of 407s has a width at
the base of 13.0s...
asked 23 minutes ago -
Calculate the collision frequency of a single N2 molecule in
nitrogen at room temperature and 1...
asked 27 minutes ago -
The vapour pressures of the pure
components P and Q are 700 Torr and 500 Torr...
asked 37 minutes ago -
2. When light enters glass it slows down. When it reemerges from
the other side it...
asked 32 minutes ago -
Calculate the pH of a 0.100 M dicarboxylic acid (H2A)
with the following Ka's (Ka1 =...
asked 34 minutes ago -
you are completing a hypothesis test. You know the following
items:
The test is a right-tailed...
asked 39 minutes ago -
An electric field at a spatial point does NOT depend on: (Choose
all the answers)
a....
asked 43 minutes ago -
As you being to perform the network-mapping phase of the
scenario, you have been asked what...
asked 47 minutes ago