1. The number of hours per week that 200 college students spend on the Internet is...
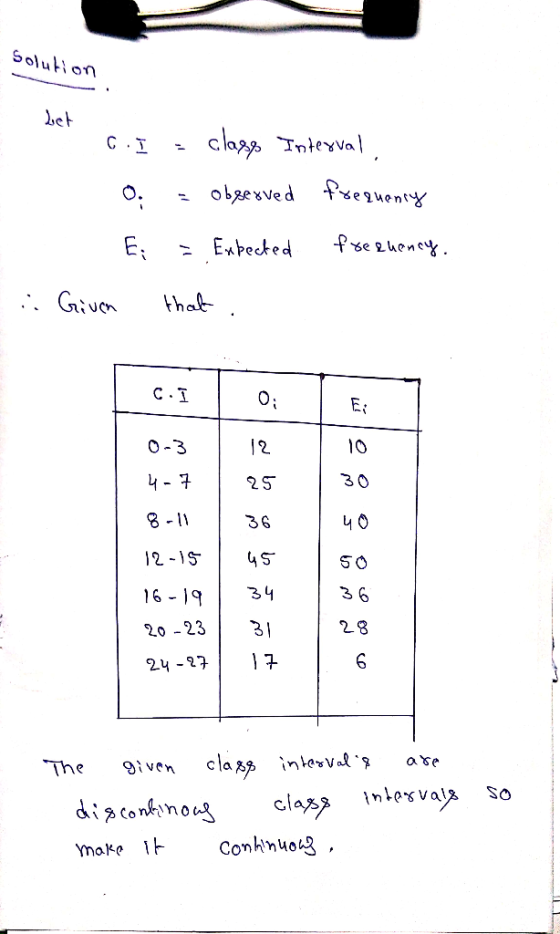
1. The number of hours per week that 200 college students spend on the Internet is grouped into classes (0 − 3),(4 − 7),(8 − 11),(12 − 15),(16 − 19),(20 − 23),(24 − 27) with observed frequencies of 12, 25, 36, 45, 34, 31, and 17. The grouped mean and standard deviation are found from the data. The null hypothesis is that the data is normally distributed. Using the mean and standard deviation, the expected frequencies are found to be 10, 30, 40, 50, 36, 28, and 6
• Calculate the χ 2 .
• What is the number of degrees of freedom?
• Find the 95% confidence level
Homework Answers
The given class intervals are discontinues class intervals. So we make it continues.


Add Answer to:
1. The number of hours per week that 200 college students spend
on the Internet is...
Assume that the number of hours college students spend working per week is normally distributed with...
 Assume that the number of hours college students spend working
per week is normally distributed with a mean of 18 hours and
standard deviation of 4 hours
2. Assume that the number of hours that college students spend working per week is normally distributed with a mean of 18 hours and a standard deviation of 4 hours. a. Mark the 7 hash marks on the x-axis with the appropriate labels in hours worked per week. Recall that the center hash...
Assume that the number of hours college students spend working
per week is normally distributed with a mean of 18 hours and
standard deviation of 4 hours
2. Assume that the number of hours that college students spend working per week is normally distributed with a mean of 18 hours and a standard deviation of 4 hours. a. Mark the 7 hash marks on the x-axis with the appropriate labels in hours worked per week. Recall that the center hash...
a-c please 3. In order to determine how many hours per week freshmen college students watch...
 a-c please
3. In order to determine how many hours per week freshmen college students watch television, a random sample of 25 students was selected. It was determined that the students in the sample spent an average of 19.5 hours with a sample standard deviation of 3.9 hours watching TV per week. Please answer the following questions: (a) Provide a 95% confidence interval estimate for the average number of hours that all college freshmen spend watching TV per week. (b)...
a-c please
3. In order to determine how many hours per week freshmen college students watch television, a random sample of 25 students was selected. It was determined that the students in the sample spent an average of 19.5 hours with a sample standard deviation of 3.9 hours watching TV per week. Please answer the following questions: (a) Provide a 95% confidence interval estimate for the average number of hours that all college freshmen spend watching TV per week. (b)...
1. To determine the average number of hours spent studying by college students per week, a...
1. To determine the average number of hours spent studying by college students per week, a sample of 39 students was randomly selected, and found to spend an average of 17.1 hours per week, with a standard deviation of 4.3 hours. Find the 90% confidence interval for the mean number of hours spent studying per week by all college students. What is the upper and lower bound? 2. If I asked a random student how many hours they study per...
QUESTION 5 In order to determine how many hours per week freshmen college students watch television,...
 QUESTION 5 In order to determine how many hours per week freshmen college students watch television, a random sample of 256 students was selected. It was determined that the students in the sample spent an average of 14 hours with a standard deviation of 3.6 hours watching TV per week. a. Provide a 95% confidence interval estimate for the average number of hours that all college freshmen spend watching TV per week. Assume that a sample of 66 students was...
The distribution of hours of sleep per week night, among college students, is found to be...
 The distribution of hours of sleep per week night, among college students, is found to be Normally distributed, with a mean of 6.5 hours and a standard deviation of 1 hour. What range contains the middle 95% of hours slept per week night by college students (a) 5.5 and 7.5 hours per week night (b) 4.5 and 7.5 hours per week night (c) 4.5 and 8.5 hours per week night 3.19
A graduate student believed that, on the average, college students spend more time on the Internet...
A graduate student believed that, on the average, college students spend more time on the Internet compared to the rest of the population. She conducted a study to determine if her hypothesis was correct. The student randomly surveyed 25 students and found that the average amount of time spent on the Internet was 8.75 hours per week with a SD = 3 hours. The last census found that, on the average, people spent 11 hour per week on the Internet....
A random sample of 46 college students reported the number of hours per day they typically spend on social media. Their...
A random sample of 46 college students reported the number of hours per day they typically spend on social media. Their sample mean is, M = 2.61, and their standard deviation is, s = 1.02. If you plan to construct a 95% confidence interval for the population mean, what t critical value should you use based on this data?
A claim is made that college students spend an average of 20 hours per week studying...
A claim is made that college students spend an average of 20 hours per week studying for their courses. You believe the true population average is different than 20 hours, and you would like to test the null hypothesis that μ = 20 hours versus the alternative hypothesis that μ ≠ 20 hours. You gather data from a random sample of 100 college students and calculate a test statistic of 1.2. This means the p-value would be what? A 0.0576...
The times that college students spend studying per week have a distribution skewed to the right...
 The times that college students spend studying per week have a distribution skewed to the right with a mean of 8.6 hours and a standard deviation of 2.8 hours. Find the probability that the mean time spent studying per week for a random sample of 49 college students would be between 8.2 and 8.9 hours. Round your answer to two decimal places.
The times that college students spend studying per week have a distribution skewed to the right...
 The times that college students spend studying per week have a distribution skewed to the right with a mean of 8.6 hours and a standard deviation of 2.8 hours. Find the probability that the mean time spent studying per week for a random sample of 16 college students would be more than 9.1 hours. Round your answer to two decimal places. Attach File Browse My Computer Browse Content Collection Browse Dropbox QUESTION 7 The GPAs of all students enrolled at...
 Assume that the number of hours college students spend working
per week is normally distributed with a mean of 18 hours and
standard deviation of 4 hours
2. Assume that the number of hours that college students spend working per week is normally distributed with a mean of 18 hours and a standard deviation of 4 hours. a. Mark the 7 hash marks on the x-axis with the appropriate labels in hours worked per week. Recall that the center hash...
Assume that the number of hours college students spend working
per week is normally distributed with a mean of 18 hours and
standard deviation of 4 hours
2. Assume that the number of hours that college students spend working per week is normally distributed with a mean of 18 hours and a standard deviation of 4 hours. a. Mark the 7 hash marks on the x-axis with the appropriate labels in hours worked per week. Recall that the center hash...
 a-c please
3. In order to determine how many hours per week freshmen college students watch television, a random sample of 25 students was selected. It was determined that the students in the sample spent an average of 19.5 hours with a sample standard deviation of 3.9 hours watching TV per week. Please answer the following questions: (a) Provide a 95% confidence interval estimate for the average number of hours that all college freshmen spend watching TV per week. (b)...
a-c please
3. In order to determine how many hours per week freshmen college students watch television, a random sample of 25 students was selected. It was determined that the students in the sample spent an average of 19.5 hours with a sample standard deviation of 3.9 hours watching TV per week. Please answer the following questions: (a) Provide a 95% confidence interval estimate for the average number of hours that all college freshmen spend watching TV per week. (b)...
 QUESTION 5 In order to determine how many hours per week freshmen college students watch television, a random sample of 256 students was selected. It was determined that the students in the sample spent an average of 14 hours with a standard deviation of 3.6 hours watching TV per week. a. Provide a 95% confidence interval estimate for the average number of hours that all college freshmen spend watching TV per week. Assume that a sample of 66 students was...
 The distribution of hours of sleep per week night, among college students, is found to be Normally distributed, with a mean of 6.5 hours and a standard deviation of 1 hour. What range contains the middle 95% of hours slept per week night by college students (a) 5.5 and 7.5 hours per week night (b) 4.5 and 7.5 hours per week night (c) 4.5 and 8.5 hours per week night 3.19
 The times that college students spend studying per week have a distribution skewed to the right with a mean of 8.6 hours and a standard deviation of 2.8 hours. Find the probability that the mean time spent studying per week for a random sample of 49 college students would be between 8.2 and 8.9 hours. Round your answer to two decimal places.
 The times that college students spend studying per week have a distribution skewed to the right with a mean of 8.6 hours and a standard deviation of 2.8 hours. Find the probability that the mean time spent studying per week for a random sample of 16 college students would be more than 9.1 hours. Round your answer to two decimal places. Attach File Browse My Computer Browse Content Collection Browse Dropbox QUESTION 7 The GPAs of all students enrolled at...
Most questions answered within 3 hours.
-
Create a balanced compensation plan that you feel would
encourage a restaurant manager to be more...
asked 3 seconds ago -
Re: Human Physiology
Comment on the differences between representing V02 max as an
absolute number and...
asked 2 minutes ago -
A firm with a WACC of 10% is considering the following mutually
exclusive projects:
0
1...
asked 7 minutes ago -
. A 100.0 mL sample of 0.18 M HClO4 is titrated with 0.27 M
LiOH. Determine...
asked 30 minutes ago -
A regression equation that describes the relationship between
the amount of the bill ($) at a...
asked 1 hour ago -
exercise on VSEPR and molecular structrue.
octahedral
SeCl62-
TeCl62-
ClF62-
distorted
SeF62–
IF6–
asked 1 hour ago -
284 mL of a 0.52 M potassium hydroxide solution is added to 467
mL of a...
asked 1 hour ago -
Little’s Law: Val d’Costa is a world famous ski village in the
French Alps. Because of...
asked 2 hours ago -
Find the absolute error D for the calculation if A + B/C=D A=
9.4 +/- 0.4...
asked 3 hours ago -
New Air Heating and Cooling, manufactures furnaces and central
air units. The company pride itself on...
asked 3 hours ago -
A coach uses a new technique to train gymnasts. Seven
gymnasts were randomly selected and their...
asked 5 hours ago -
While rotating the tires on your car you notice a rock [mass =
0.1 Kg] stuck...
asked 7 hours ago