Please help with the following, and please provide the 'R' code! Thank you! A student researcher...
Please help with the following, and please provide the 'R' code! Thank you! A student researcher believes that the average number of typo’s produced by Pro- fessor Who Ha per lecture is less than 28. After picking a statistical test, the student analyzed 50 lectures and recorded the number of typos as Xi for i = 1, 2, . . . , 50. The random sample yields X ̄ = 25.9 and s = 5.6.
a) Pick a test and carefully follow the 7 steps in the procedure to make your decision using α = 0.05. You may assume normality of the data, but σ is unknown. Make sure and plot out (by hand is fine) the rejection region for both the test statistic, and the non-standardized scale.
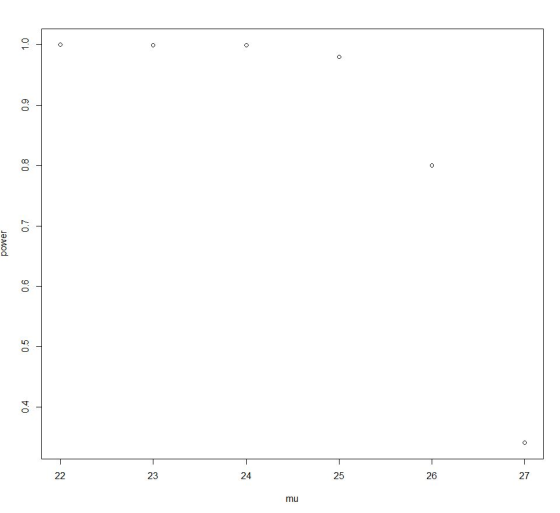
b) Plot the power curve for rejecting H0: μ ≥ 28 at α = 0.05 by computing the power P(μR) for μR = 22, 23, 24, 25, 26, 27.
Homework Answers
a)
rejection region
n <- 50
df <- n-1
s <- 5.6
xbar <- 25.9
mu <- 28
t = qt(0.05 , df)
rejectValue <- mu - t * s/sqrt(n)
rejectValue
> rejectValue
26.67224
we reject if
t < -1.676551
or
Xbar <
26.67224
b)
mu <- 22:27
power <- pt( (rejectValue -mu) /(s/sqrt(n)) , df)
power
plot(mu,power)
power
[1] 0.9999998 0.9999867 0.9992727 0.9800743 0.7999482 0.3403912
Add Answer to:
Please help with the following, and please provide the 'R' code!
Thank you! A student researcher...
Hello, may someone please help me out with.. a through d? Thank you so much greatly appreciated. 3. An eugiser wishes to prove that the mean weight of metal comnets rodtscel by a proces is greater...
 Hello, may someone please help me out with.. a through d?
Thank you so much greatly appreciated.
3. An eugiser wishes to prove that the mean weight of metal comnets rodtscel by a proces is greater than 4.5 oz. A random sample of 10 components produces the data: 4.5, 5.6, 4.9 3.8, 4.1, 4.3, 4.4, 4.7, 5.0, 4.6 (a) Make a dot plot of the weights. Is it reasonable to assume that the weights have a normal/bell-shaped distribution? Note: There...
Hello, may someone please help me out with.. a through d?
Thank you so much greatly appreciated.
3. An eugiser wishes to prove that the mean weight of metal comnets rodtscel by a proces is greater than 4.5 oz. A random sample of 10 components produces the data: 4.5, 5.6, 4.9 3.8, 4.1, 4.3, 4.4, 4.7, 5.0, 4.6 (a) Make a dot plot of the weights. Is it reasonable to assume that the weights have a normal/bell-shaped distribution? Note: There...
Really short question! Please help me to solve part(b), also need the R code, thank you!...
 Really short question! Please help me to solve part(b), also
need the R code, thank you!
Problem 4 [26 points] (Section 2.4): Consider a one-sample z-test (known variance) with hypotheses: Ho: μ lo vs H, μ μο. a/2 where φ(.)Is the CDF of N(0,1), d-layo, and δ is the difference between the true mean and the mean under Ho (a) [10 points] Based on the fact that φ(x) [pdf of N(0,1)] is a decreasing function in x when x> 0,...
Really short question! Please help me to solve part(b), also
need the R code, thank you!
Problem 4 [26 points] (Section 2.4): Consider a one-sample z-test (known variance) with hypotheses: Ho: μ lo vs H, μ μο. a/2 where φ(.)Is the CDF of N(0,1), d-layo, and δ is the difference between the true mean and the mean under Ho (a) [10 points] Based on the fact that φ(x) [pdf of N(0,1)] is a decreasing function in x when x> 0,...
Really short question! Please help me to solve ONLY part(b) with R code. Thank you! Problem...
 Really short question! Please help me to solve ONLY part(b)
with R code. Thank you!
Problem 4 [26 points] (Section 2.4): Consider a one-sample z-test (known variance) with hypotheses: Ho: μ lo vs H, μ *Ho. The probability of Type II error can be written in the form |ß D(%2_Jnd)-0(-%2_Jnd) where Φ㈠ is the CDF of N(0,1), d Isyo, and δ is the difference between the true mean and the mean under Ho (a) [10 points] Based on the fact...
Really short question! Please help me to solve ONLY part(b)
with R code. Thank you!
Problem 4 [26 points] (Section 2.4): Consider a one-sample z-test (known variance) with hypotheses: Ho: μ lo vs H, μ *Ho. The probability of Type II error can be written in the form |ß D(%2_Jnd)-0(-%2_Jnd) where Φ㈠ is the CDF of N(0,1), d Isyo, and δ is the difference between the true mean and the mean under Ho (a) [10 points] Based on the fact...
Use R 1. A light bulb manufacturer claims their light bulbs as for 1,000 hours. You...
 Use R
1. A light bulb manufacturer claims their light bulbs as for 1,000 hours. You sample 50 light bulbs and you find that the sample average light bulb lifetime duration is 955 hours. Assume that you know the population standard deviation, and that it is 220 hours. That is n 50、 x"= 955, σ = 220 Test the null hypothesis Ho: μ-1,000 against the alternative hypothesis Ha: μ < 1,000 at the 0.05 significance level a. Calculate the critical...
Use R
1. A light bulb manufacturer claims their light bulbs as for 1,000 hours. You sample 50 light bulbs and you find that the sample average light bulb lifetime duration is 955 hours. Assume that you know the population standard deviation, and that it is 220 hours. That is n 50、 x"= 955, σ = 220 Test the null hypothesis Ho: μ-1,000 against the alternative hypothesis Ha: μ < 1,000 at the 0.05 significance level a. Calculate the critical...
**R-STUDIO KNOWLEDGE REQUIRED*** PLEASE ANSWER THE FOLLOWING WITH ****R-STUDIO**** CODING- thank ...
 **R-STUDIO KNOWLEDGE REQUIRED***
PLEASE ANSWER THE FOLLOWING WITH ****R-STUDIO****
CODING- thank you so much!!
I am specifically look for the solution to part
***(h)**** and *****(i)***** below using R-Studio
code:
The data set in question
is:
YEAR Height Stories
1990 770 54
1980 677 47
1990 428 28
1989 410 38
1966 371 29
1976 504 38
1974 1136 80
1991 695 52
1982 551 45
1986 550 40
1931 568 49
1979 504 33
1988 560 50
1973 512...
**R-STUDIO KNOWLEDGE REQUIRED***
PLEASE ANSWER THE FOLLOWING WITH ****R-STUDIO****
CODING- thank you so much!!
I am specifically look for the solution to part
***(h)**** and *****(i)***** below using R-Studio
code:
The data set in question
is:
YEAR Height Stories
1990 770 54
1980 677 47
1990 428 28
1989 410 38
1966 371 29
1976 504 38
1974 1136 80
1991 695 52
1982 551 45
1986 550 40
1931 568 49
1979 504 33
1988 560 50
1973 512...
Please help me correct my MATLAB script code for this problem, thank you!! A projectile PA is launched from point A towards the east with an initial launch velocity voa and an initial...
 Please help me correct my MATLAB script code for this
problem, thank you!!
A projectile PA is launched from point A towards the east with an initial launch velocity voa and an initial lauw angle of 0x. The impact point of the projectile Pa is a point B in a valley with an ordinate, yon, located below the clevation of point A. The launch from point A is instantaneously detected at point B, and a counter projectile P launched simultaneously...
Please help me correct my MATLAB script code for this
problem, thank you!!
A projectile PA is launched from point A towards the east with an initial launch velocity voa and an initial lauw angle of 0x. The impact point of the projectile Pa is a point B in a valley with an ordinate, yon, located below the clevation of point A. The launch from point A is instantaneously detected at point B, and a counter projectile P launched simultaneously...
please use python and provide run result, thank you! click on pic to make it bigger...
 please use python and provide run result, thank you!
click on pic to make it bigger
For this assignment you will have to investigate the use of the Python random library's random generator function, random.randrange(stop), randrange produces a random integer in the range of 0 to stop-1. You will need to import random at the top of your program. You can find this in the text or using the online resources given in the lectures A Slot Machine Simulation Understand...
please use python and provide run result, thank you!
click on pic to make it bigger
For this assignment you will have to investigate the use of the Python random library's random generator function, random.randrange(stop), randrange produces a random integer in the range of 0 to stop-1. You will need to import random at the top of your program. You can find this in the text or using the online resources given in the lectures A Slot Machine Simulation Understand...
please help with whatever possible. thank you so much in advance. Name One use of serial...
 please help with whatever possible. thank you so much in
advance.
Name One use of serial dilutions is to calculate the concentration of microorganisms. Since it would usually be challenging or even impossible to actually count the number of microorganisms in a sample, the sample is diluted and plated to get a reasonable number of colonies to count (usually between 25 to 250 colonies is the goal). Since each colony on an agar plate theoretically grew from a single microorganism,...
please help with whatever possible. thank you so much in
advance.
Name One use of serial dilutions is to calculate the concentration of microorganisms. Since it would usually be challenging or even impossible to actually count the number of microorganisms in a sample, the sample is diluted and plated to get a reasonable number of colonies to count (usually between 25 to 250 colonies is the goal). Since each colony on an agar plate theoretically grew from a single microorganism,...
 Hello, may someone please help me out with.. a through d?
Thank you so much greatly appreciated.
3. An eugiser wishes to prove that the mean weight of metal comnets rodtscel by a proces is greater than 4.5 oz. A random sample of 10 components produces the data: 4.5, 5.6, 4.9 3.8, 4.1, 4.3, 4.4, 4.7, 5.0, 4.6 (a) Make a dot plot of the weights. Is it reasonable to assume that the weights have a normal/bell-shaped distribution? Note: There...
Hello, may someone please help me out with.. a through d?
Thank you so much greatly appreciated.
3. An eugiser wishes to prove that the mean weight of metal comnets rodtscel by a proces is greater than 4.5 oz. A random sample of 10 components produces the data: 4.5, 5.6, 4.9 3.8, 4.1, 4.3, 4.4, 4.7, 5.0, 4.6 (a) Make a dot plot of the weights. Is it reasonable to assume that the weights have a normal/bell-shaped distribution? Note: There...
 Really short question! Please help me to solve part(b), also
need the R code, thank you!
Problem 4 [26 points] (Section 2.4): Consider a one-sample z-test (known variance) with hypotheses: Ho: μ lo vs H, μ μο. a/2 where φ(.)Is the CDF of N(0,1), d-layo, and δ is the difference between the true mean and the mean under Ho (a) [10 points] Based on the fact that φ(x) [pdf of N(0,1)] is a decreasing function in x when x> 0,...
Really short question! Please help me to solve part(b), also
need the R code, thank you!
Problem 4 [26 points] (Section 2.4): Consider a one-sample z-test (known variance) with hypotheses: Ho: μ lo vs H, μ μο. a/2 where φ(.)Is the CDF of N(0,1), d-layo, and δ is the difference between the true mean and the mean under Ho (a) [10 points] Based on the fact that φ(x) [pdf of N(0,1)] is a decreasing function in x when x> 0,...
 Really short question! Please help me to solve ONLY part(b)
with R code. Thank you!
Problem 4 [26 points] (Section 2.4): Consider a one-sample z-test (known variance) with hypotheses: Ho: μ lo vs H, μ *Ho. The probability of Type II error can be written in the form |ß D(%2_Jnd)-0(-%2_Jnd) where Φ㈠ is the CDF of N(0,1), d Isyo, and δ is the difference between the true mean and the mean under Ho (a) [10 points] Based on the fact...
Really short question! Please help me to solve ONLY part(b)
with R code. Thank you!
Problem 4 [26 points] (Section 2.4): Consider a one-sample z-test (known variance) with hypotheses: Ho: μ lo vs H, μ *Ho. The probability of Type II error can be written in the form |ß D(%2_Jnd)-0(-%2_Jnd) where Φ㈠ is the CDF of N(0,1), d Isyo, and δ is the difference between the true mean and the mean under Ho (a) [10 points] Based on the fact...
 Use R
1. A light bulb manufacturer claims their light bulbs as for 1,000 hours. You sample 50 light bulbs and you find that the sample average light bulb lifetime duration is 955 hours. Assume that you know the population standard deviation, and that it is 220 hours. That is n 50、 x"= 955, σ = 220 Test the null hypothesis Ho: μ-1,000 against the alternative hypothesis Ha: μ < 1,000 at the 0.05 significance level a. Calculate the critical...
Use R
1. A light bulb manufacturer claims their light bulbs as for 1,000 hours. You sample 50 light bulbs and you find that the sample average light bulb lifetime duration is 955 hours. Assume that you know the population standard deviation, and that it is 220 hours. That is n 50、 x"= 955, σ = 220 Test the null hypothesis Ho: μ-1,000 against the alternative hypothesis Ha: μ < 1,000 at the 0.05 significance level a. Calculate the critical...
 **R-STUDIO KNOWLEDGE REQUIRED***
PLEASE ANSWER THE FOLLOWING WITH ****R-STUDIO****
CODING- thank you so much!!
I am specifically look for the solution to part
***(h)**** and *****(i)***** below using R-Studio
code:
The data set in question
is:
YEAR Height Stories
1990 770 54
1980 677 47
1990 428 28
1989 410 38
1966 371 29
1976 504 38
1974 1136 80
1991 695 52
1982 551 45
1986 550 40
1931 568 49
1979 504 33
1988 560 50
1973 512...
**R-STUDIO KNOWLEDGE REQUIRED***
PLEASE ANSWER THE FOLLOWING WITH ****R-STUDIO****
CODING- thank you so much!!
I am specifically look for the solution to part
***(h)**** and *****(i)***** below using R-Studio
code:
The data set in question
is:
YEAR Height Stories
1990 770 54
1980 677 47
1990 428 28
1989 410 38
1966 371 29
1976 504 38
1974 1136 80
1991 695 52
1982 551 45
1986 550 40
1931 568 49
1979 504 33
1988 560 50
1973 512...
 Please help me correct my MATLAB script code for this
problem, thank you!!
A projectile PA is launched from point A towards the east with an initial launch velocity voa and an initial lauw angle of 0x. The impact point of the projectile Pa is a point B in a valley with an ordinate, yon, located below the clevation of point A. The launch from point A is instantaneously detected at point B, and a counter projectile P launched simultaneously...
Please help me correct my MATLAB script code for this
problem, thank you!!
A projectile PA is launched from point A towards the east with an initial launch velocity voa and an initial lauw angle of 0x. The impact point of the projectile Pa is a point B in a valley with an ordinate, yon, located below the clevation of point A. The launch from point A is instantaneously detected at point B, and a counter projectile P launched simultaneously...
 please use python and provide run result, thank you!
click on pic to make it bigger
For this assignment you will have to investigate the use of the Python random library's random generator function, random.randrange(stop), randrange produces a random integer in the range of 0 to stop-1. You will need to import random at the top of your program. You can find this in the text or using the online resources given in the lectures A Slot Machine Simulation Understand...
please use python and provide run result, thank you!
click on pic to make it bigger
For this assignment you will have to investigate the use of the Python random library's random generator function, random.randrange(stop), randrange produces a random integer in the range of 0 to stop-1. You will need to import random at the top of your program. You can find this in the text or using the online resources given in the lectures A Slot Machine Simulation Understand...
 please help with whatever possible. thank you so much in
advance.
Name One use of serial dilutions is to calculate the concentration of microorganisms. Since it would usually be challenging or even impossible to actually count the number of microorganisms in a sample, the sample is diluted and plated to get a reasonable number of colonies to count (usually between 25 to 250 colonies is the goal). Since each colony on an agar plate theoretically grew from a single microorganism,...
please help with whatever possible. thank you so much in
advance.
Name One use of serial dilutions is to calculate the concentration of microorganisms. Since it would usually be challenging or even impossible to actually count the number of microorganisms in a sample, the sample is diluted and plated to get a reasonable number of colonies to count (usually between 25 to 250 colonies is the goal). Since each colony on an agar plate theoretically grew from a single microorganism,...
Most questions answered within 3 hours.
-
Two blocks of masses m1 and m2 hang at the ends of a string that
passes...
asked 25 seconds from now -
Linear programming is an excellent technique yet is not applied
nearly enough in the “real world.”...
asked 8 minutes ago -
What three alkenes yield 3-methylpentane on catalytic
hydrogenation?
asked 8 minutes ago -
In JAVA Create a program with an array with the following
data:
50 12 31 76...
asked 11 minutes ago -
Using a hormone of the hypothalamic-anterior pituitary axis,
describe or diagram how negative feedback loops regulate...
asked 9 minutes ago -
1,1-dimethylcyclorohexane reacts with single bromine atom
asked 32 minutes ago -
The completed Lewis structure of CO2 contains a total
of 0,1,2,3,4,5,6,7,8 covalent bonds
and 0,1,2,3,4,5,6,7,8 lone pairs.
NOTE:...
asked 38 minutes ago -
A 0.0510 M solution of an organic acid has an
[H+] of 7.50×10⁻⁴M .
What is...
asked 35 minutes ago -
what is the profit-maximizing output condition that a
monopolistically competitive firm must satisfy? a) price charged...
asked 40 minutes ago -
Consider the set of ordered pairs shown below. Assuming that the
regression equation is y=3.513+0.429x and...
asked 1 hour ago -
1. (A) Write two
structural (constitutional)
isomers of C4H8F2?
Please show all of
the
asked 1 hour ago -
Objective: Practice converting a Boolean logic
expression into it’s truth table and to show the implementation...
asked 1 hour ago