


Homework Answers
Answer:
1)

2)
a)
> xbar=955 #sample mean
>
> mu0=1000 #hypothesized value
>
> sigma=220 #population standard deviation
>
> n<-seq(10,200,5) # n values from 10 to 200 by margin of
5
>
> pval=rep(0,length(n)) # define p value as same of length of
"n"
>
> for(i in 1:length(n)){
+ z= (xbar-mu0)/(sigma/sqrt(n[i]))
+ pval[i]=pnorm(z)
+ }
>
> plot(n,pval,xlab="sample size",ylab="p-value",main = "P value
as n increases")
b)
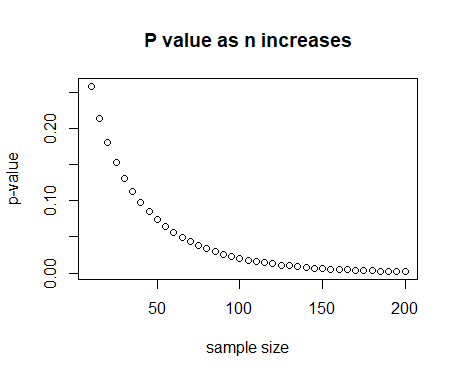
Comment :- as sample size increases the P value is decreases.i.e result become significant as sample size increases.
c) n >= 65 will give us the statistically significant result.
in R it can be done as
> g<-data.frame(n,pval)
> subset(g,pval<0.05)
n pval
12 65 0.049563762
13 70 0.043508256
14 75 0.038245808
15 80 0.033661609
16 85 0.029659883
17 90 0.026160171
18 95 0.023094476
19 100 0.020405033
20 105 0.018042550
21 110 0.015964801
22 115 0.014135485
23 120 0.012523302
24 125 0.011101189
25 130 0.009845691
26 135 0.008736431
27 140 0.007755678
28 145 0.006887969
29 150 0.006119801
30 155 0.005439364
31 160 0.004836313
32 165 0.004301577
33 170 0.003827193
34 175 0.003406162
35 180 0.003032326
36 185 0.002700262
37 190 0.002405192
38 195 0.002142902
39 200 0.001909671
3)
assuming it is two-tailed test
mu0=1000 #hypothesized value
sigma=220 #population standard deviation, sqrt(102)
n=50 #sample size
xbar <- seq(920,1000,5)
pval = 2* (1- pnorm(abs((xbar-mu0)/(sigma/sqrt(n)))))
pval
plot(xbar,pval)
 4)
4)
Let indicate the true
mean of the population
We want to test the following hypotheses
R code to do this left tail test (all statements starting with # are comments)
xBar<-955 #sample mean
mu0<-1000 #hypothesized value
n<-50 #sample size
#a vector of population standard deviations, from 120 to
250
sigma<-seq(120,250,by=5)
#test statistic
z<- (xBar-mu0)/(sigma/sqrt(n))
#p-values, lower tail values P(Z<-z)
pval<-pnorm(z,lower.tail=TRUE)
#plot
plot(sigma,pval,type="l",xlab="Population standard
deviation",ylab="p-value",main="p-value vs population sd")
#set the level of significance
alpha<-0.025
#find the range of population standard deviations with
p-val<alpha
sigma[pval<alpha]
#get this plot
a)

We can see that the p-value increases as the population standard deviation increases.
We know that the standard error of mean is calculated using
where
We can see that the standard error of mean increases with the population standard deviation for a given n.
Next the value of test statistics is
We can see that for a given sample average, the absolute value of z decreases (or the value of negative of z increase) with the increase in standard error (that is increase in population standard deviation)
This is a left tail test. Hence the p-value = P(Z<-z) will only increase when the absolute value of z decrease
b) Out put from R is below
![> #find the range of population standard deviations with p-val alpha > sigma [pval<alpha] 1] 120 125 130 135 140 145 150 155](http://img.homeworklib.com/questions/5a9a2650-a448-11ea-a99d-81a104d9d426.png?x-oss-process=image/resize,w_560)
we will get statistically significant results when the p-value is less than the level of significance alpha.
For a level of significance alpha=0.025, we can see that we will get statistically significant results when the population standard deviation is between 120 to 160 (approximate), holding the sample average and sample size constant
5)
We reject the null hypothesis when p value<0.05 ie z<-1.645
ie 
ie
ie is the rejection region interms of
b)tru_mu<-seq(800,1000,by=10) will generate numbers from 800 to 1000 in intervals of 10
c) power of the test is probability of rejecting the null hypothesis when actually it not true
P(

When true  the command interms of qnorm is
norm(1.57) will give you the required probability
so here the required r code is
z<-{948.82-trumu}/{220/sqrt(50)}
z
power<- pnorm(z) will give you the vector of probabilities corresponding to the alternatives from 800 to 1000 in the interval of 10
d) plot( tru_mu,power, main="power curve", ylab="power of the test",xlab="mu")

e) From the graph when mu ranges from 800 to 920 power is greater than 80%
Note: the r codes are given in italics
Add Answer to:
Use R
1. A light bulb manufacturer claims their light bulbs as for 1,000 hours. You...
A light bulb manufacturer claims that the mean life of a certain type of light bulb is 750 hours. If a random sample of 36 light bulbs has a mean life of 725 hours with a standard deviation of 60 hours. Use a=0.05
A light bulb manufacturer claims that the mean life of a certain type of light bulb is 750 hours. If a random sample of 36 light bulbs has a mean life of 725 hours with a standard deviation of 60 hours. Use a=0.05a. State the null and alternative hypotheses.b. State the Type I and Type II errors.c. Find the critical value. Do you have enough evidence to reject the manufacturer’s claim?d. Find the p-value.e. Construct a 95% confidence interval for...
A manufacturer claims his light bulbs have a mean life of 2000 hours. A consumer group...
 A manufacturer claims his light bulbs have a mean life of 2000 hours. A consumer group wants to test if their light bulbs do not last as long as the manufacturer claims. They tested a random sample of 210 bulbs and found them to have a sample mean life of 1980 hours and a sample standard deviation of 50 hours. Assess the manufacturer's claim. a) What is the null hypothesis? Ou = 2000 O x = 2000 Ox< 2000 Ou...
A light bulb manufacturer guarantees that the mean life of a certain type of light bulb...
A light bulb manufacturer guarantees that the mean life of a certain type of light bulb is at least 753 hours. A random sample of 20 light bulbs has a mean life of 732 hours. Assume the population is normally distributed and the population standard deviation is 61 hours. At α=0.02, do you have enough evidence to reject the manufacturer's claim? Complete parts (a) through (e). (a) Identify the null hypothesis and alternative hypothesis. A. H0: μ<732 (claim) Ha: μ≥732...
A manufacturer claims his light bulbs have a mean life of 1800 hours. A consumer group...
 A manufacturer claims his light bulbs have a mean life of 1800 hours. A consumer group wants to test if their light bulbs do not last as long as the manufacturer claims. They tested a random sample of 270 bulbs and found them to have a sample mean life of 1790 hours and a sample standard deviation of 60 hours. Assess the manufacturer's claim. a) What is the null hypothesis? Correct: y = 1800 Incorrect x = 1800 Incorrect x...
A manufacturer claims his light bulbs have a mean life of 1800 hours. A consumer group...
 A manufacturer claims his light bulbs have a mean life of 1800 hours. A consumer group wants to test if their light bulbs do not last as long as the manufacturer claims. They tested a random sample of 230 bulbs and found them to have a sample mean life of 1790 hours and a sample standard deviation of 50 hours. Assess the manufacturer's claim. a) What is the null hypothesis? 正确:D=1800 错误x = 1800 错误x<1800 错误p> 1800 正确答案! 以前的尝试 您的证明编号是153-43332...
Data Se Sample Variables 1 Proportions Observations 1000 p-bar for 1,000 samples (n 50] drawn fro...
 Data Se Sample Variables 1 Proportions Observations 1000 p-bar for 1,000 samples (n 50] drawn from a binomial population (p 0.30) Minitab was used to generate the samples. Observations> Observations Variable Type Form Values Missing Sample Proportion Quantitative Numeric 1000 Variable Correlation Correlation If the sample you select for your statistical study is one of the 1,000 samples we drew in our repeated sampling, the worst-luck sample you could draw proportion. Use the tool to sort the observed values of...
2. A manufacturer of transistors claims that its transistors will last an average of 1000 hours....
 2. A manufacturer of transistors claims that its transistors will last an average of 1000 hours. To maintain this claim, 25 resistors are tested each month. What conclusions can you draw from a sample that has a mean of 1010 and a standard deviation of 60? You may assume that the distribution of the lifetime of a transistor is normal [NOTE: To receive FULL CREDIT, you must conduct a COMPLETE hypothesis test and make your conclusions using BOTH a fixed...
i-1i0 (Two Choices: (a) or (b)) 1. One may decrease the power of a hypothesis test...
 i-1i0 (Two Choices: (a) or (b)) 1. One may decrease the power of a hypothesis test by increasing the sample size n. True (b) False 2, The Central Limit Theorem even applies to a sample meany from a population with a uniform distribution. (a) True (b) False 3. If events A, B, and Care all mutually-independent, then P(A u B u C) P(A) + P(B) + P(C (a) True (b) False 4. For any data set, at least half of...
please i need to solve 2 and 3 and please explain everything and write I commend...
 please i need to solve 2 and 3 and please explain everything
and write I commend
sing R please, 1. Generate 5,000 iid samples from the standard normal distribution; compute the mean of these random samples. Repeat this process 100 times so you would have stored 100 sample averages. Plot the sample averages using hist() and lines(density() in R. What do you observe? 2. Compute the mean and variance of Binomial distribution with parameters m and p directly from definition...
please i need to solve 2 and 3 and please explain everything
and write I commend
sing R please, 1. Generate 5,000 iid samples from the standard normal distribution; compute the mean of these random samples. Repeat this process 100 times so you would have stored 100 sample averages. Plot the sample averages using hist() and lines(density() in R. What do you observe? 2. Compute the mean and variance of Binomial distribution with parameters m and p directly from definition...
Use Microsoft Excel to solve the problem, and either show a screenshot of how you solved...
 Use Microsoft Excel to solve the problem, and either show a
screenshot of how you solved it, and or explain each command that
you used.
Use Excel function int (rand()/(1-p)) for generating random numbers of value 0 and 1 with probability P(-1) p. 2, Make in Excel three tables size 50 x 100, 250 × 100, 1000 × 100 with Bernoulli distributed random numbers for p(1) 3/13. Use the generated tables for calculating new column of random numbers equal to...
Use Microsoft Excel to solve the problem, and either show a
screenshot of how you solved it, and or explain each command that
you used.
Use Excel function int (rand()/(1-p)) for generating random numbers of value 0 and 1 with probability P(-1) p. 2, Make in Excel three tables size 50 x 100, 250 × 100, 1000 × 100 with Bernoulli distributed random numbers for p(1) 3/13. Use the generated tables for calculating new column of random numbers equal to...
 A manufacturer claims his light bulbs have a mean life of 2000 hours. A consumer group wants to test if their light bulbs do not last as long as the manufacturer claims. They tested a random sample of 210 bulbs and found them to have a sample mean life of 1980 hours and a sample standard deviation of 50 hours. Assess the manufacturer's claim. a) What is the null hypothesis? Ou = 2000 O x = 2000 Ox< 2000 Ou...
 A manufacturer claims his light bulbs have a mean life of 1800 hours. A consumer group wants to test if their light bulbs do not last as long as the manufacturer claims. They tested a random sample of 270 bulbs and found them to have a sample mean life of 1790 hours and a sample standard deviation of 60 hours. Assess the manufacturer's claim. a) What is the null hypothesis? Correct: y = 1800 Incorrect x = 1800 Incorrect x...
 A manufacturer claims his light bulbs have a mean life of 1800 hours. A consumer group wants to test if their light bulbs do not last as long as the manufacturer claims. They tested a random sample of 230 bulbs and found them to have a sample mean life of 1790 hours and a sample standard deviation of 50 hours. Assess the manufacturer's claim. a) What is the null hypothesis? 正确:D=1800 错误x = 1800 错误x<1800 错误p> 1800 正确答案! 以前的尝试 您的证明编号是153-43332...
 Data Se Sample Variables 1 Proportions Observations 1000 p-bar for 1,000 samples (n 50] drawn from a binomial population (p 0.30) Minitab was used to generate the samples. Observations> Observations Variable Type Form Values Missing Sample Proportion Quantitative Numeric 1000 Variable Correlation Correlation If the sample you select for your statistical study is one of the 1,000 samples we drew in our repeated sampling, the worst-luck sample you could draw proportion. Use the tool to sort the observed values of...
 2. A manufacturer of transistors claims that its transistors will last an average of 1000 hours. To maintain this claim, 25 resistors are tested each month. What conclusions can you draw from a sample that has a mean of 1010 and a standard deviation of 60? You may assume that the distribution of the lifetime of a transistor is normal [NOTE: To receive FULL CREDIT, you must conduct a COMPLETE hypothesis test and make your conclusions using BOTH a fixed...
 i-1i0 (Two Choices: (a) or (b)) 1. One may decrease the power of a hypothesis test by increasing the sample size n. True (b) False 2, The Central Limit Theorem even applies to a sample meany from a population with a uniform distribution. (a) True (b) False 3. If events A, B, and Care all mutually-independent, then P(A u B u C) P(A) + P(B) + P(C (a) True (b) False 4. For any data set, at least half of...
 please i need to solve 2 and 3 and please explain everything
and write I commend
sing R please, 1. Generate 5,000 iid samples from the standard normal distribution; compute the mean of these random samples. Repeat this process 100 times so you would have stored 100 sample averages. Plot the sample averages using hist() and lines(density() in R. What do you observe? 2. Compute the mean and variance of Binomial distribution with parameters m and p directly from definition...
please i need to solve 2 and 3 and please explain everything
and write I commend
sing R please, 1. Generate 5,000 iid samples from the standard normal distribution; compute the mean of these random samples. Repeat this process 100 times so you would have stored 100 sample averages. Plot the sample averages using hist() and lines(density() in R. What do you observe? 2. Compute the mean and variance of Binomial distribution with parameters m and p directly from definition...
 Use Microsoft Excel to solve the problem, and either show a
screenshot of how you solved it, and or explain each command that
you used.
Use Excel function int (rand()/(1-p)) for generating random numbers of value 0 and 1 with probability P(-1) p. 2, Make in Excel three tables size 50 x 100, 250 × 100, 1000 × 100 with Bernoulli distributed random numbers for p(1) 3/13. Use the generated tables for calculating new column of random numbers equal to...
Use Microsoft Excel to solve the problem, and either show a
screenshot of how you solved it, and or explain each command that
you used.
Use Excel function int (rand()/(1-p)) for generating random numbers of value 0 and 1 with probability P(-1) p. 2, Make in Excel three tables size 50 x 100, 250 × 100, 1000 × 100 with Bernoulli distributed random numbers for p(1) 3/13. Use the generated tables for calculating new column of random numbers equal to...
Most questions answered within 3 hours.
-
The function x = (7.9 m) cos[(4πrad/s)t + π/3 rad] gives the
simple harmonic motion of...
asked 8 seconds ago -
A sample of steam with a mass of 0.501 g at a temperature of 100
∘C...
asked 32 minutes ago -
I1(t) and I2(t) describe the intensity of two
light waves.
I1(t)= 10sin(30t+π/4)
I2(t)=
10sin(30.4t+π)
Assume that...
asked 27 minutes ago -
True or False: Spinal nerves emerging from the vertebral column
are ONLY motor OR sensory.
Select...
asked 14 minutes ago -
last question i found wrong so downvoted so dont copy
paste or dont try if you...
asked 10 minutes ago -
A block sits on the floor. (a) What is the magnitude of the
frictional force on...
asked 34 minutes ago -
Thanks so much for the help! Please show all work.
A uniform solid disk with radius...
asked 14 minutes ago -
Please use Logicly!
Create a 4 bit sequential counter that is capable of counting up
or...
asked 22 minutes ago -
state one specific part from disability law such as ADA
(Americans with Disability Acts) or policy...
asked 34 minutes ago -
please simplify how vapor pressure lowering is related to a
rise in the boiling point solution
asked 49 minutes ago -
write a java program that does the following
Part one
Use a For loop to compute...
asked 47 minutes ago -
"A student in another class made a claim that many people are
now talking about outlawing...
asked 48 minutes ago