
Homework Answers
a) Here dot plot is:
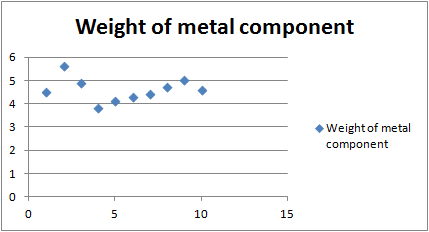
here the sample data is very small i.e. n = 10 . so we cannot cannot say that weights have normal distribution on the basis of this sample.
Add Answer to:
Hello, may someone please help me out with.. a through d? Thank you so much greatly appreciated. 3. An eugiser wishes to prove that the mean weight of metal comnets rodtscel by a proces is greater...
PLEASE HELP ME OUT WITH BOTH QUESTIONS!!! it is greatly appreciated!! thank you so much. no need to show the work. You w...
 PLEASE
HELP ME OUT WITH BOTH QUESTIONS!!!
it is greatly appreciated!! thank you so much. no need to show
the work.
You wish to test the claim that the average IQ score is less than 100 at the .005 significance level. You determine the hypotheses are: Ho:u= 100 H1:4 < 100 You take a simple random sample of 72 individuals and find the mean IQ score is 96.7, with a standard deviation of 15.5. Let's consider testing this hypothesis two...
PLEASE
HELP ME OUT WITH BOTH QUESTIONS!!!
it is greatly appreciated!! thank you so much. no need to show
the work.
You wish to test the claim that the average IQ score is less than 100 at the .005 significance level. You determine the hypotheses are: Ho:u= 100 H1:4 < 100 You take a simple random sample of 72 individuals and find the mean IQ score is 96.7, with a standard deviation of 15.5. Let's consider testing this hypothesis two...
Someone plz plz help with this Statistics Intro to R programming question!!! Here are the examples and follow by my question!! Thank you so much!! I appreciate it !!!!My question!!!! Question T...
 Someone plz plz help with this Statistics Intro to R programming
question!!!
Here are the examples and follow by my question!!
Thank you so much!! I appreciate it
!!!!My question!!!!
Question Type 1: If possible, calculate the 90% confidence intervals for the temperature it takes for crickets to chirp 15 chirps per second. Code (you must copy and paste your code like below in blue color): # Reading in the data Crickets-read.table(C:/Desktop/CricketChirpsvsTemperature.csv', header TRUE, #View Data View Crickets) #Data analysis...
Someone plz plz help with this Statistics Intro to R programming
question!!!
Here are the examples and follow by my question!!
Thank you so much!! I appreciate it
!!!!My question!!!!
Question Type 1: If possible, calculate the 90% confidence intervals for the temperature it takes for crickets to chirp 15 chirps per second. Code (you must copy and paste your code like below in blue color): # Reading in the data Crickets-read.table(C:/Desktop/CricketChirpsvsTemperature.csv', header TRUE, #View Data View Crickets) #Data analysis...
 PLEASE
HELP ME OUT WITH BOTH QUESTIONS!!!
it is greatly appreciated!! thank you so much. no need to show
the work.
You wish to test the claim that the average IQ score is less than 100 at the .005 significance level. You determine the hypotheses are: Ho:u= 100 H1:4 < 100 You take a simple random sample of 72 individuals and find the mean IQ score is 96.7, with a standard deviation of 15.5. Let's consider testing this hypothesis two...
PLEASE
HELP ME OUT WITH BOTH QUESTIONS!!!
it is greatly appreciated!! thank you so much. no need to show
the work.
You wish to test the claim that the average IQ score is less than 100 at the .005 significance level. You determine the hypotheses are: Ho:u= 100 H1:4 < 100 You take a simple random sample of 72 individuals and find the mean IQ score is 96.7, with a standard deviation of 15.5. Let's consider testing this hypothesis two...
 Someone plz plz help with this Statistics Intro to R programming
question!!!
Here are the examples and follow by my question!!
Thank you so much!! I appreciate it
!!!!My question!!!!
Question Type 1: If possible, calculate the 90% confidence intervals for the temperature it takes for crickets to chirp 15 chirps per second. Code (you must copy and paste your code like below in blue color): # Reading in the data Crickets-read.table(C:/Desktop/CricketChirpsvsTemperature.csv', header TRUE, #View Data View Crickets) #Data analysis...
Someone plz plz help with this Statistics Intro to R programming
question!!!
Here are the examples and follow by my question!!
Thank you so much!! I appreciate it
!!!!My question!!!!
Question Type 1: If possible, calculate the 90% confidence intervals for the temperature it takes for crickets to chirp 15 chirps per second. Code (you must copy and paste your code like below in blue color): # Reading in the data Crickets-read.table(C:/Desktop/CricketChirpsvsTemperature.csv', header TRUE, #View Data View Crickets) #Data analysis...
Most questions answered within 3 hours.
-
A horizontal mass of M=5kg is on a spring and stretched to
x=0.5m when released from...
asked 18 minutes ago -
26 of 50
"I have worked at the Arizona Humane Society for ten years, and
have...
asked 39 minutes ago -
Compare and contrast zero based budgeting and incremental (or
base year) budgeting.
asked 37 minutes ago -
4 pts 10. Which of the following hypothesis would be MOST
difficult to test experimentally? Group...
asked 39 minutes ago -
A business owner makes 1,000 items a day. Each day he or she
contributes eight hours...
asked 41 minutes ago -
A
circular loop in the plane of a paper lies inca0.65 T magnetic
field pointing into...
asked 58 minutes ago -
A business owner is trying to decide whether to buy, rent, or
lease office space and...
asked 58 minutes ago -
Thermal Storage Solar heating of a house is much more efficient
if there is a way...
asked 1 hour ago -
Considering the “fits” for group and job design dimensions,
suppose you had 12 employees with different...
asked 1 hour ago -
Consider TCP connection management.
How many segments are typically involved in the TCP connection
establishment? What...
asked 1 hour ago -
1. You placed a stop-loss order to sell 500 shares of AAPL with
a stop price...
asked 1 hour ago -
Sylva Warehousing desired to locate a central warehouse to serve
five North Carolina markets. Placed on...
asked 1 hour ago