1. Design a 10th-order lowpass FIR filter using the window method (fir1) to cut frequencies above...
1. Design a 10th-order lowpass FIR filter using the window method (fir1) to cut frequencies
above 30Hz in an application where the sampling frequency is 125 Hz.
2. Plot the filter coefficients that define the filter (stem).
3. Plot the frequency response of the FIR filter designed (freqz)
4. Design a 100th-order lowpass FIR filter using the window method (fir1) to cut frequencies
above 30Hz in an application where the sampling frequency is 125 Hz. Plot the filter
coefficients that defining the filter (stem). Plot the frequency response of the FIR filter
designed (freqz). Compare the frequency response of the 10th-order with the 100th-order
filter.
5. Design a 10th-order highpass FIR filter using the window method (fir1) to cut frequencies
below 30Hz in an application where the sampling frequency is 125 Hz.
6. Plot the filter coefficients that define the filter (stem).
7. Plot the frequency response of the FIR filter designed (freqz)
8. Design a 100th-order highpass FIR filter using the window method (fir1) to cut
frequencies below 15Hz in an application where the sampling frequency is 125 Hz. Plot
the filter coefficients that define the filter (stem). Plot the frequency response of the
FIR filter designed (freqz). Compare the frequency response of the 10th-order with the
100th-order filter.
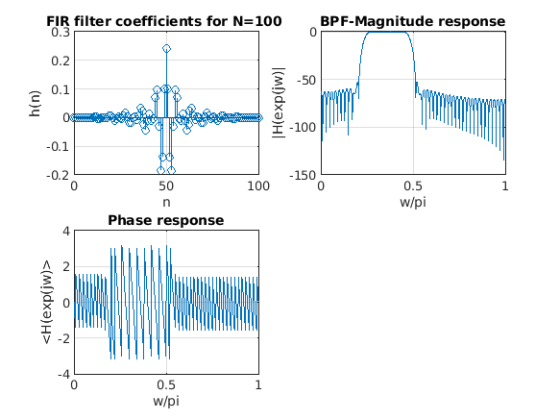
9. Design a 100th-order bandpass FIR filter using the window method (fir1) to cut
frequencies below 15Hz and above 30 Hz in an application where the sampling frequency
is 125 Hz. Plot the filter coefficients that defining the filter (stem). Plot the frequency
response of the FIR filter designed (freqz).
0. Design a 100th-order bandstop FIR filter using the window method (fir1) to cut
frequencies between 15Hz and 30 Hz in an application where the sampling frequency
is 125 Hz. Plot the filter coefficients that defining the filter (stem). Plot the frequency
response of the FIR filter designed (freqz).
11. Design a 100th-order bandpass FIR filter using the window method (fir2) to cut
frequencies below 15Hz and above 30 Hz in an application where the sampling frequency
is 125 Hz. Plot the filter coefficients that defining the filter (stem). Plot the frequency
response of the FIR filter designed (freqz).
Homework Answers
10th order LPF FIR
clc;close all;clear all;
N=10;fc=30;Fs=125;
n=0:1:N;
wc=2*fc/Fs;
h=fir1(N,wc);
w=0:pi/1000:pi;
H=freqz(h,1,w);
figure;
subplot(221)
stem(n,h);grid;
xlabel('n');ylabel('h(n)')
title('FIR filter coeffiecients for N=10 ')
subplot(222)
plot(w/pi,20*log10(abs(H)));grid;
xlabel('w/pi');ylabel('|H(exp(jw)|')
title('Magnitude response')
subplot(223)
plot(w/pi,angle(H));grid;
xlabel('w/pi');ylabel('<H(exp(jw)>')
title('Phase response')

__________________________________________________________________________
100th order LPF FIR
N=100;fc=30;Fs=125;
n=0:1:N;
wc=2*fc/Fs;
h=fir1(N,wc);
w=0:pi/1000:pi;
H=freqz(h,1,w);
figure;
subplot(221)
stem(n,h);grid;
xlabel('n');ylabel('h(n)')
title('FIR filter coeffiecients for N=100 ')
subplot(222)
plot(w/pi,20*log10(abs(H)));grid;
xlabel('w/pi');ylabel('|H(exp(jw)|')
title('Magnitude response')
subplot(223)
plot(w/pi,angle(H));grid;
xlabel('w/pi');ylabel('<H(exp(jw)>')
title('Phase response')

____________________________________________________________________________
clc;close all;clear all;
N=10;fc=15;Fs=125;
n=0:1:N;
wc=2*fc/Fs;
h=fir1(N,wc,'high');
w=0:pi/1000:pi;
H=freqz(h,1,w);
figure;
subplot(221)
stem(n,h);grid;
xlabel('n');ylabel('h(n)')
title('FIR filter coeffiecients for N=10 ')
subplot(222)
plot(w/pi,20*log10(abs(H)));grid;
xlabel('w/pi');ylabel('|H(exp(jw)|')
title('HPF-Magnitude response')
subplot(223)
plot(w/pi,angle(H));grid;
xlabel('w/pi');ylabel('<H(exp(jw)>')
title('Phase response')

N=100;fc=30;Fs=125;
n=0:1:N;
wc=2*fc/Fs;
h=fir1(N,wc,'high');
w=0:pi/1000:pi;
H=freqz(h,1,w);
figure;
subplot(221)
stem(n,h);grid;
xlabel('n');ylabel('h(n)')
title('FIR filter coeffiecients for N=100 ')
subplot(222)
plot(w/pi,20*log10(abs(H)));grid;
xlabel('w/pi');ylabel('|H(exp(jw)|')
title('HPF-Magnitude response')
subplot(223)
plot(w/pi,angle(H));grid;
xlabel('w/pi');ylabel('<H(exp(jw)>')
title('Phase response')

clc;close all;clear all;
%band pass filter
N=100;fc1=15;fc2=30;Fs=125;
n=0:1:N;
wc=[2*fc1/Fs 2*fc2/Fs] ;
h=fir1(N,wc,'bandpass');
w=0:pi/1000:pi;
H=freqz(h,1,w);
figure;
subplot(221)
stem(n,h);grid;
xlabel('n');ylabel('h(n)')
title('FIR filter coefficients for N=100 ')
subplot(222)
plot(w/pi,20*log10(abs(H)));grid;
xlabel('w/pi');ylabel('|H(exp(jw)|')
title('BPF-Magnitude response')
subplot(223)
plot(w/pi,angle(H));grid;
xlabel('w/pi');ylabel('<H(exp(jw)>')
title('Phase response')
%Band stop filter
N=100;fc1=15;fc2=30;Fs=125;
wc=[2*fc1/Fs 2*fc2/Fs] ;
n=0:1:N;
h=fir1(N,wc,'stop');
w=0:pi/1000:pi;
H=freqz(h,1,w);
figure;
subplot(221)
stem(n,h);grid;
xlabel('n');ylabel('h(n)')
title('FIR filter coefficients for N=100 ')
subplot(222)
plot(w/pi,20*log10(abs(H)));grid;
xlabel('w/pi');ylabel('|H(exp(jw)|')
title('BSF-Magnitude response')
subplot(223)
plot(w/pi,angle(H));grid;
xlabel('w/pi');ylabel('<H(exp(jw)>')
title('Phase response')

Add Answer to:
1. Design a 10th-order lowpass FIR filter using the window
method (fir1) to cut frequencies
above...
7.29. Design a 41-tap bandpass FIR filter with lower and upper cutoff frequencies of 2,500 Hz...
7.29. Design a 41-tap bandpass FIR filter with lower and upper cutoff frequencies of 2,500 Hz and 3,000 Hz, respectively, using the following window functions. Assume a sampling frequency of 8,000 Hz. a. Hanning window function b. Blackman window function. List the FIR filter coefficients and plot the frequency responses for each design. 7.30 Design a 41-tap band reject FIR filter with cutoff frequencies of 2,500 Hz and 3,000 Hz, respectively, using the Hamming window function. Assume a sampling frequency...
Design lowpass IIR filter with the following specifications: Filter order = 2, Butterworth type C...
Design lowpass IIR filter with the following specifications: Filter order = 2, Butterworth type Cut-off frequency=800 Hz Sampling rate =8000 Hz Design using the bilinear z-transform design method Print the lowpass IIR filter coefficients and plot the frequency responses using MATLAB. MATLAB>>freqz(bLP,aLP,512,8000); axis([0 4000 –40 1]); Label and print your graph. What is the filter gain at the cut-off frequency 800 Hz? What are the filter gains for the stopband at 2000 Hz and the passband at 50 Hz based...
7.3. Design a 5-tap FIR lowpass filter with a cutoff frequency of 100 Hz and a...
 7.3. Design a 5-tap FIR lowpass filter with a cutoff frequency of 100 Hz and a sampling rate of 1,000 Hz using a a. rectangular window function b. Hamming window function Determine the transfer function and difference equation of the designed FIR system, and compute and plot the magnitude frequency response for ?--0, ?/4, ?/2, 3r/4, and ? radians.
3. Design a bandpass FIR filter using Kaiser's formula for filter order, using Hamming window with...
 3. Design a bandpass FIR filter using Kaiser's formula for filter order, using Hamming window with the following specifications: the lower passband and stopband edge frequencies are fpi- 700 Hz, fs1 - 300 Hz, the upper passband and stopband edge frequencies fp2 - 2 kHz fs2 - 2400 Hz, the sampling frequency fs-10 kHz, and 6p-0.03, ando0.004.
1 Design a 4th order causal FIR bandpass filter with cutoff frequencies at 9 kHz and...
 1 Design a 4th order causal FIR bandpass filter with cutoff frequencies at 9 kHz and 18kHz and sampling frequency of 54 kHz. Use a Blackman window. Give precise numerical values for the filter coefficients. The Blackman window has coefficients as shown below (you need choose one window among the three listed below so that a 4 order linear phase filter is designed. (Circle the one you choose). (35pts) Blackman window 1 O.2008 0.8492 0.8492 0.2008 Blackman window 2 0.1300...
b) When designing a FIR filters, the impulse response of the ideal low-pass filter is usually modified by multiplying i...
 b) When designing a FIR filters, the impulse response of the ideal low-pass filter is usually modified by multiplying it by a windowing function such as the Hamming window which is defined, for an odd number N of samples, by: (2n)-(N-I)-ns(N-1) N-12 wlnl 0.54 + 0.46 cos i What are the advantages of windowing with this function compared 2 with a standard rectangular window? ii) Design a 10th Order Hamming windowed FIR low-pass filter with cut- off frequency at 1000...
Design a 5-tap FIR bandpass filter
Design a 5-tap FIR bandpass filter with a lower cutoff frequency of1,600 Hz, an upper cutoff frequency of 1,800 Hz, and a sampling rateof 8,000 Hz using a. rectangular window functionb. Hamming window function.Determine the transfer function and difference equation of the designedFIR system, and compute and plot the magnitude frequency responsefor Ω= 0, π/4, π/2, 3π/4, and π radians.PLEASE SHOW STEPS CLEARLY
matlab code as well please. 7. (100) Design a bandpass FIR filter with the following Spec:...
 matlab code as well please.
7. (100) Design a bandpass FIR filter with the following Spec: (a) Lower cut off frequency: 1250Hz, (b) lower transition width: 1500Hz, (c) upper cutoff frequency: 2850 Hz, (d) upper transition width: 1300 Hz, (e) stop band attenuation: 60dB, (f) passband ripple 0.02 dB, and (g) sampling frequency: 8000Hz. Your answer needs to include (i) normalized frequencies, (ii) Window type, (iii) order of the filter and their numerical values computed by matlab command firwd(), and...
matlab code as well please.
7. (100) Design a bandpass FIR filter with the following Spec: (a) Lower cut off frequency: 1250Hz, (b) lower transition width: 1500Hz, (c) upper cutoff frequency: 2850 Hz, (d) upper transition width: 1300 Hz, (e) stop band attenuation: 60dB, (f) passband ripple 0.02 dB, and (g) sampling frequency: 8000Hz. Your answer needs to include (i) normalized frequencies, (ii) Window type, (iii) order of the filter and their numerical values computed by matlab command firwd(), and...
1. Design a custom FIR band-pass filter using the Fourier series and the Hanning window. The...
1. Design a custom FIR band-pass filter using the Fourier series and the Hanning window. The filter should be of order 8. We need to pass the signal in two audio bands 400-1600Hz and 4000-8000Hz and attenuate it elsewhere. The sampling frequency is 20 kHz. a) Calculate with pencil and paper the impulse response of the filter and the numerical values of the coefficients.
3. A length 21, FIR lowpass filter is designed using the windowing method, and rectan gular windo...
 3. A length 21, FIR lowpass filter is designed using the windowing method, and rectan gular window is employed. The ideal frequency response on which the design is based 1s given by If the filter's impulse response is 2πη sin 0
 7.3. Design a 5-tap FIR lowpass filter with a cutoff frequency of 100 Hz and a sampling rate of 1,000 Hz using a a. rectangular window function b. Hamming window function Determine the transfer function and difference equation of the designed FIR system, and compute and plot the magnitude frequency response for ?--0, ?/4, ?/2, 3r/4, and ? radians.
 3. Design a bandpass FIR filter using Kaiser's formula for filter order, using Hamming window with the following specifications: the lower passband and stopband edge frequencies are fpi- 700 Hz, fs1 - 300 Hz, the upper passband and stopband edge frequencies fp2 - 2 kHz fs2 - 2400 Hz, the sampling frequency fs-10 kHz, and 6p-0.03, ando0.004.
 1 Design a 4th order causal FIR bandpass filter with cutoff frequencies at 9 kHz and 18kHz and sampling frequency of 54 kHz. Use a Blackman window. Give precise numerical values for the filter coefficients. The Blackman window has coefficients as shown below (you need choose one window among the three listed below so that a 4 order linear phase filter is designed. (Circle the one you choose). (35pts) Blackman window 1 O.2008 0.8492 0.8492 0.2008 Blackman window 2 0.1300...
 b) When designing a FIR filters, the impulse response of the ideal low-pass filter is usually modified by multiplying it by a windowing function such as the Hamming window which is defined, for an odd number N of samples, by: (2n)-(N-I)-ns(N-1) N-12 wlnl 0.54 + 0.46 cos i What are the advantages of windowing with this function compared 2 with a standard rectangular window? ii) Design a 10th Order Hamming windowed FIR low-pass filter with cut- off frequency at 1000...
 matlab code as well please.
7. (100) Design a bandpass FIR filter with the following Spec: (a) Lower cut off frequency: 1250Hz, (b) lower transition width: 1500Hz, (c) upper cutoff frequency: 2850 Hz, (d) upper transition width: 1300 Hz, (e) stop band attenuation: 60dB, (f) passband ripple 0.02 dB, and (g) sampling frequency: 8000Hz. Your answer needs to include (i) normalized frequencies, (ii) Window type, (iii) order of the filter and their numerical values computed by matlab command firwd(), and...
matlab code as well please.
7. (100) Design a bandpass FIR filter with the following Spec: (a) Lower cut off frequency: 1250Hz, (b) lower transition width: 1500Hz, (c) upper cutoff frequency: 2850 Hz, (d) upper transition width: 1300 Hz, (e) stop band attenuation: 60dB, (f) passband ripple 0.02 dB, and (g) sampling frequency: 8000Hz. Your answer needs to include (i) normalized frequencies, (ii) Window type, (iii) order of the filter and their numerical values computed by matlab command firwd(), and...
 3. A length 21, FIR lowpass filter is designed using the windowing method, and rectan gular window is employed. The ideal frequency response on which the design is based 1s given by If the filter's impulse response is 2πη sin 0
Most questions answered within 3 hours.
-
An
Atwood's machine has one block of m1 = 0.370 kg and the other is of...
asked 12 seconds from now -
Why is Kevlar a stronger fabric then dacron? Provide two reasons
involving structures.
asked 14 minutes ago -
Suppose you have a checkers board. (8 squares wide and 8
squares long) and you
have...
asked 34 minutes ago -
Given the following function: QD = 200 - 5.25P
7.1 Derive the Regular Demand Function
7.2...
asked 28 minutes ago -
The following results were obtained as
part of a multiple regression analysis involving 3 independent
variables:...
asked 1 hour ago -
The time to complete a standardized exam is approximately normal
with a mean of 70 minutes...
asked 3 hours ago -
Two thousand randomly selected adults were asked whether or not
they have ever shopped on the...
asked 3 hours ago -
Estimate the diffusion coefficient for methyl phenyl sulfide in
water at 25 degrees Celcius.
asked 2 hours ago -
10.g of a certain metal absorb 40. cal of heat and the temperature
is abserved to...
asked 3 hours ago -
How many milliliters of 0.0695 M Ca( OH)
2would be required to exactly neutralize 176 mL...
asked 4 hours ago -
A telephone survey uses a random digit dialing machine to call
subjects. The random digit dialing...
asked 4 hours ago -
How can having too little or too much of a certain
protein cause problems for an...
asked 6 hours ago