Consider the following data drawn independently from normally distributed populations: (You may find it useful to...
Consider the following data drawn independently from normally
distributed populations: (You may find it useful to
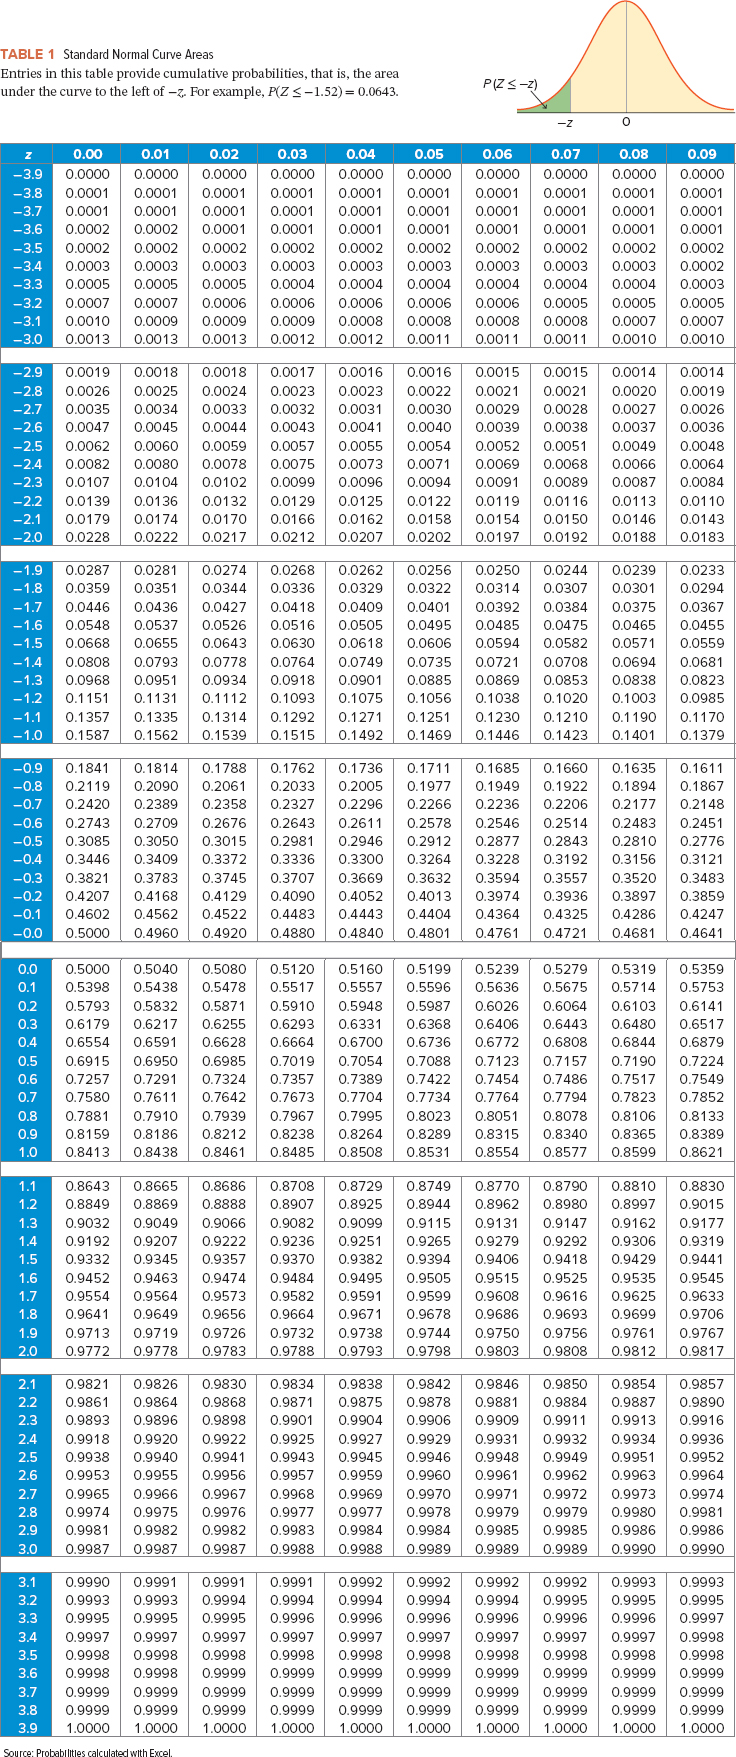
reference the appropriate table: z table
or t table)
| x−1x−1 = −25.8 | x−2x−2 = −16.2 |
| s12 = 8.5 | s22 = 8.8 |
| n1 = 26 | n2 = 20 |
a. Construct the 99% confidence interval for the
difference between the population means. Assume the population
variances are unknown but equal. (Round all intermediate
calculations to at least 4 decimal places and final answers to 2
decimal places.)
Homework Answers
The statistical software output for this problem is :

The 99% confidence interval for the difference between the population means is :
(-11.95 , -7.25)
Add Answer to:
Consider the following data drawn independently from normally
distributed populations: (You may find it useful to...
Consider the following data drawn independently from normally distributed populations: (You may find it useful to...
Consider the following data drawn independently from normally distributed populations: (You may find it useful to reference the appropriate table: z table or t table) x−1x−1 = 32.7 x−2x−2 = 25.4 σ12 = 95.5 σ22 = 91.0 n1 = 16 n2 = 21 a. Construct the 90% confidence interval for the difference between the population means. (Negative values should be indicated by a minus sign. Round all intermediate calculations to at least 4 decimal places and final answers to 2...
Consider the following data drawn independently from normally distributed populations: (You may find it useful to...
 Consider the following data drawn independently from normally distributed populations: (You may find it useful to reference the appropriate table: z table or t table) *1 = -28.3 s12 = 8.7 ni = 22 X2 = -18.5 s 2 = 7.9 n2 = 16 a. Construct the 95% confidence interval for the difference between the population means. Assume the population variances are unknown but equal. (Round all intermediate calculations to at least 4 decimal places and final answers to 2...
Consider the following data drawn independently from normally distributed populations: (You may find it useful to...
 Consider the following data drawn independently from normally distributed populations: (You may find it useful to reference the appropriate table: z table or t table 31.6x2 26.8 σ12-91.9 σ22-90.0 120 2-26 a. Construct the 99% confidence interval for the difference between the population means Negative values should be indicated b, a minus sign. Round all intermediate calculations to at least 4 decimal places and final answers to 2 decimal places.) Confidence interval is to
Consider the following data drawn independently from normally distributed populations: (You may find it useful to...
Consider the following data drawn independently from normally distributed populations: (You may find it useful to reference the appropriate table: z table or t table) x−1x−1 = 27.7 x−2x−2 = 30.1 σ12 = 92.8 σ22 = 87.5 n1 = 24 n2 = 33 a. Construct the 99% confidence interval for the difference between the population means. (Negative values should be indicated by a minus sign. Round all intermediate calculations to at least 4 decimal places and final answers to 2...
Consider the following measures based on independently drawn samples from normally distributed populations: (You may find...
Consider the following measures based on independently drawn samples from normally distributed populations: (You may find it useful to reference the appropriate table: chi-square table or F table) Sample 1: s21s12 = 221, and n1 = 16 Sample 2: s22s22 = 208, and n2 = 11 a. Construct the 95% interval estimate for the ratio of the population variances. (Round "F" value and final answers to 2 decimal places.) Confidence interval _______ to _______ B. Using the confidence interval from...
Consider the following competing hypotheses and accompanying sample data drawn independently from normally distributed populations. (You...
Consider the following competing hypotheses and accompanying sample data drawn independently from normally distributed populations. (You may find it useful to reference the appropriate table: z table or t table) H0: μ1 − μ2 ≥ 0 HA: μ1 − μ2 < 0 x−1 x − 1 = 222 x−2 x − 2 = 253 s1 = 32 s2 = 26 n1 = 12 n2 = 12 a-1. Calculate the value of the test statistic under the assumption that the population...
Consider the following measures based on independently drawn samples from normally distributed populations Ợou may find...
 Consider the following measures based on independently drawn samples from normally distributed populations Ợou may find it useful to reference the appropriate table: chi-square table or F table) Sample 1: s 221, and n1 - 16 Sample 2:s 208, and n2 11 a. Construct the 95% interval estimate for the ratio of the population variances. (Round "F' value and final answers to 2 decimal places.) Confidence interval to b. Using the confidence interval from Part (a), test if the ratio...
Return to question Consider the following data drawn independently from normally distributed populations: (You may find...
 Return to question Consider the following data drawn independently from normally distributed populations: (You may find it useful to reference the appropriate table: z table or t table) X1 = 30.5 012 = 96.3 ni = 27. x2 = 24.7 022 = 93.1 n2 = 26 a. Construct the 95% confidence interval for the difference between the population means. (Negative values should be indicated by a minus sign. Round all intermediate calculations to at least 4 decimal places and final...
Consider the following data drawn independently from normally distributed populations: (You may find it useful to...
 Consider the following data drawn independently from normally distributed populations: (You may find it useful to reference the appropriate table: z table or t table) X1 = 27.1 012 = 89.5 n1 = 25 X2 = 30.3 022 = 92.3 n2 = 31 a. Construct the 90% confidence interval for the difference between the population means. (Negative values should be indicated by a minus sign. Round all intermediate calculations to at least 4 decimal places and final answers to 2...
Consider the following competing hypotheses and accompanying sample data drawn independently from normally distributed populations. (You may find it useful to reference the appropriate table: z table or t table)
 Consider the following competing hypotheses and accompanying sample data drawn independently from normally distributed populations. (You may find it useful to reference the appropriate table: z table or t table) H0: μ1 − μ2 = 0HA: μ1 − μ2 ≠ 0 x−1x−1 = 57x−2 = 63σ1 = 11.5σ2 = 15.2n1 = 20n2 = 20a-1. Calculate the value of the test statistic. (Negative values should be indicated by a minus sign. Round all intermediate calculations to at least 4 decimal places and final answer to 2 decimal places.)Test Statistic ?
 Consider the following data drawn independently from normally distributed populations: (You may find it useful to reference the appropriate table: z table or t table) *1 = -28.3 s12 = 8.7 ni = 22 X2 = -18.5 s 2 = 7.9 n2 = 16 a. Construct the 95% confidence interval for the difference between the population means. Assume the population variances are unknown but equal. (Round all intermediate calculations to at least 4 decimal places and final answers to 2...
 Consider the following data drawn independently from normally distributed populations: (You may find it useful to reference the appropriate table: z table or t table 31.6x2 26.8 σ12-91.9 σ22-90.0 120 2-26 a. Construct the 99% confidence interval for the difference between the population means Negative values should be indicated b, a minus sign. Round all intermediate calculations to at least 4 decimal places and final answers to 2 decimal places.) Confidence interval is to
 Consider the following measures based on independently drawn samples from normally distributed populations Ợou may find it useful to reference the appropriate table: chi-square table or F table) Sample 1: s 221, and n1 - 16 Sample 2:s 208, and n2 11 a. Construct the 95% interval estimate for the ratio of the population variances. (Round "F' value and final answers to 2 decimal places.) Confidence interval to b. Using the confidence interval from Part (a), test if the ratio...
 Return to question Consider the following data drawn independently from normally distributed populations: (You may find it useful to reference the appropriate table: z table or t table) X1 = 30.5 012 = 96.3 ni = 27. x2 = 24.7 022 = 93.1 n2 = 26 a. Construct the 95% confidence interval for the difference between the population means. (Negative values should be indicated by a minus sign. Round all intermediate calculations to at least 4 decimal places and final...
 Consider the following data drawn independently from normally distributed populations: (You may find it useful to reference the appropriate table: z table or t table) X1 = 27.1 012 = 89.5 n1 = 25 X2 = 30.3 022 = 92.3 n2 = 31 a. Construct the 90% confidence interval for the difference between the population means. (Negative values should be indicated by a minus sign. Round all intermediate calculations to at least 4 decimal places and final answers to 2...
Most questions answered within 3 hours.
-
Please help me with FLOWCHART and UML diagram for class,
thank you!
#include <iostream>
#include <fstream>...
asked 37 minutes ago -
3. Describe the “logic circuit” of the Lac operon. Which
proteins are bound or not to...
asked 38 minutes ago -
Ayesha’s adjusted gross income is $60,000 in 2019. She donated a
piece of artwork with a...
asked 44 minutes ago -
For Dijkstra’s shortest path algorithm:
a. Give the Big-O time for Dijkstra’s shortest path algorithm
and...
asked 57 minutes ago -
Phosphorus violates the 'octet rule' in biological molecules,
forming more covalent bonds than expected based on...
asked 1 hour ago -
A 1.3 eV electron has a 10-4 probability of tunneling
through a 2.4 eV potential barrier....
asked 1 hour ago -
What is the one ingredient that is common to being successful
with all stakeholders?
profit
trust...
asked 1 hour ago -
Write an assembly language 32 bit program that reads in lines of
text by a .txt...
asked 1 hour ago -
what is the density ( in g/L) of hydrogen gas at 29 degrees C and a...
asked 1 hour ago -
5-6. You are considering three investment alternatives for some
spare cash: Old Reliable Corporation stock (A1),...
asked 1 hour ago -
Problem 16-02
Receivables Investment
Medwig Corporation has a DSO of 45 days. The company averages
$7,250...
asked 1 hour ago -
Mr. Brown hired Lowe's Maintenance Services Limited to repair
and paint the exterior wall of his...
asked 1 hour ago