Consider the following data drawn independently from normally distributed populations: (You may find it useful to...
Consider the following data drawn independently from normally
distributed populations: (You may find it useful to
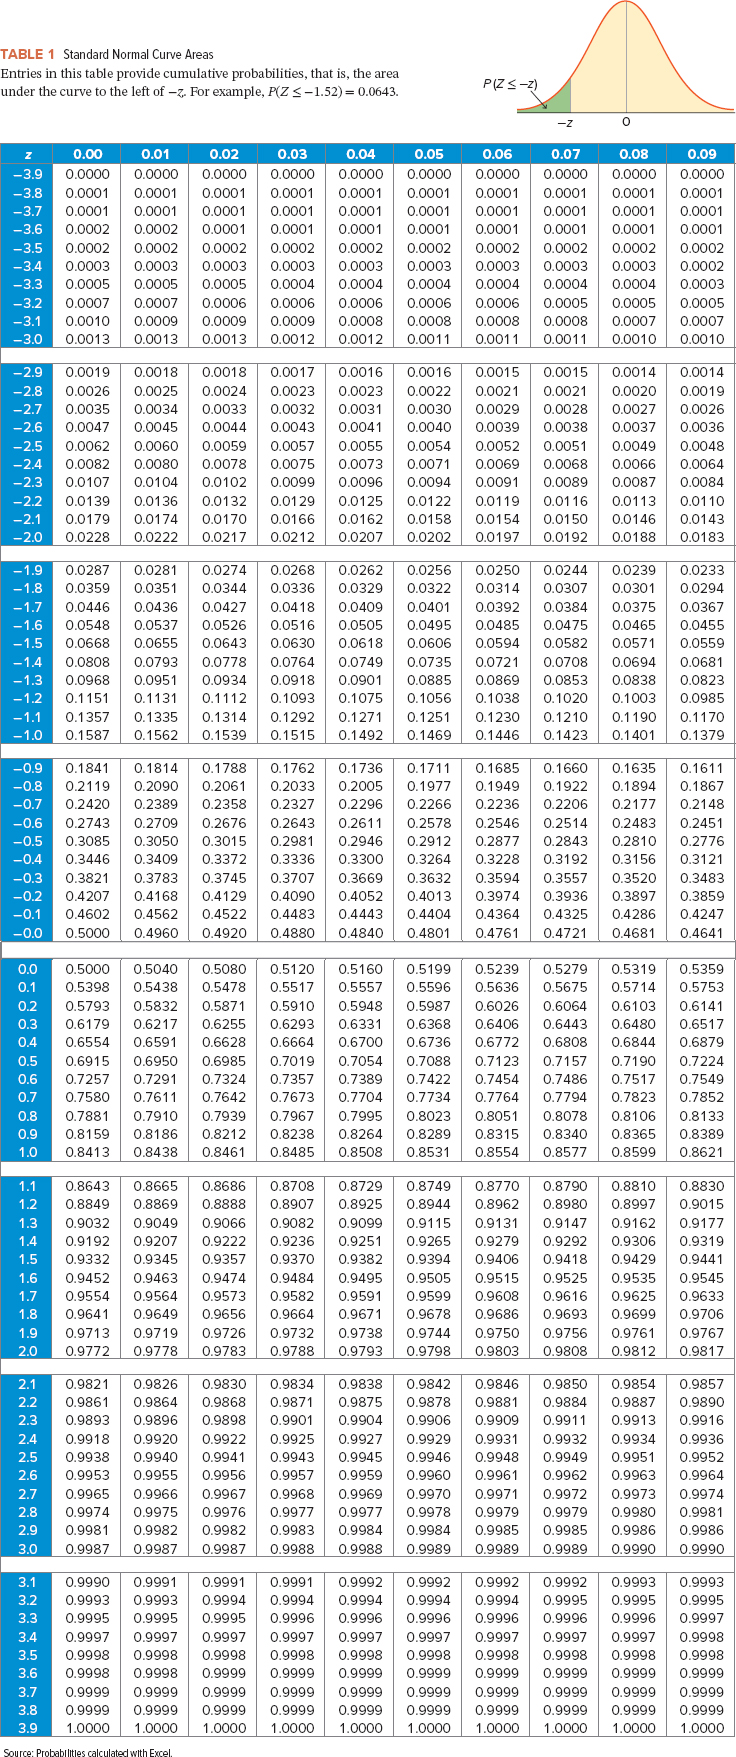
reference the appropriate table: z table
or t table)
| x−1x−1 = 32.7 | x−2x−2 = 25.4 |
| σ12 = 95.5 | σ22 = 91.0 |
| n1 = 16 | n2 = 21 |
a. Construct the 90% confidence interval for the
difference between the population means.
(Negative values should be indicated by a
minus sign. Round all intermediate calculations to at least 4
decimal places and final answers to 2 decimal
places.)
Confidence interval is ______ to ______
Homework Answers
Here

and 
a) a 90% confidence interval for the difference between the population means


 (ans)
(ans)
Add Answer to:
Consider the following data drawn independently from normally
distributed populations: (You may find it useful to...
Consider the following data drawn independently from normally distributed populations: (You may find it useful to...
 Consider the following data drawn independently from normally distributed populations: (You may find it useful to reference the appropriate table: z table or t table 31.6x2 26.8 σ12-91.9 σ22-90.0 120 2-26 a. Construct the 99% confidence interval for the difference between the population means Negative values should be indicated b, a minus sign. Round all intermediate calculations to at least 4 decimal places and final answers to 2 decimal places.) Confidence interval is to
Consider the following data drawn independently from normally distributed populations: (You may find it useful to...
Consider the following data drawn independently from normally distributed populations: (You may find it useful to reference the appropriate table: z table or t table) x−1x−1 = −25.8 x−2x−2 = −16.2 s12 = 8.5 s22 = 8.8 n1 = 26 n2 = 20 a. Construct the 99% confidence interval for the difference between the population means. Assume the population variances are unknown but equal. (Round all intermediate calculations to at least 4 decimal places and final answers to 2 decimal...
Consider the following data drawn independently from normally distributed populations: (You may find it useful to...
Consider the following data drawn independently from normally distributed populations: (You may find it useful to reference the appropriate table: z table or t table) x−1x−1 = 27.7 x−2x−2 = 30.1 σ12 = 92.8 σ22 = 87.5 n1 = 24 n2 = 33 a. Construct the 99% confidence interval for the difference between the population means. (Negative values should be indicated by a minus sign. Round all intermediate calculations to at least 4 decimal places and final answers to 2...
Consider the following data drawn independently from normally distributed populations: (You may find it useful to...
 Consider the following data drawn independently from normally distributed populations: (You may find it useful to reference the appropriate table: z table or t table) *1 = -28.3 s12 = 8.7 ni = 22 X2 = -18.5 s 2 = 7.9 n2 = 16 a. Construct the 95% confidence interval for the difference between the population means. Assume the population variances are unknown but equal. (Round all intermediate calculations to at least 4 decimal places and final answers to 2...
Return to question Consider the following data drawn independently from normally distributed populations: (You may find...
 Return to question Consider the following data drawn independently from normally distributed populations: (You may find it useful to reference the appropriate table: z table or t table) X1 = 30.5 012 = 96.3 ni = 27. x2 = 24.7 022 = 93.1 n2 = 26 a. Construct the 95% confidence interval for the difference between the population means. (Negative values should be indicated by a minus sign. Round all intermediate calculations to at least 4 decimal places and final...
Consider the following data drawn independently from normally distributed populations: (You may find it useful to...
 Consider the following data drawn independently from normally distributed populations: (You may find it useful to reference the appropriate table: z table or t table) X1 = 27.1 012 = 89.5 n1 = 25 X2 = 30.3 022 = 92.3 n2 = 31 a. Construct the 90% confidence interval for the difference between the population means. (Negative values should be indicated by a minus sign. Round all intermediate calculations to at least 4 decimal places and final answers to 2...
Consider the following measures based on independently drawn samples from normally distributed populations: (You may find...
Consider the following measures based on independently drawn samples from normally distributed populations: (You may find it useful to reference the appropriate table: chi-square table or F table) Sample 1: s21s12 = 221, and n1 = 16 Sample 2: s22s22 = 208, and n2 = 11 a. Construct the 95% interval estimate for the ratio of the population variances. (Round "F" value and final answers to 2 decimal places.) Confidence interval _______ to _______ B. Using the confidence interval from...
Consider the following measures based on independently drawn samples from normally distributed populations Ợou may find...
 Consider the following measures based on independently drawn samples from normally distributed populations Ợou may find it useful to reference the appropriate table: chi-square table or F table) Sample 1: s 221, and n1 - 16 Sample 2:s 208, and n2 11 a. Construct the 95% interval estimate for the ratio of the population variances. (Round "F' value and final answers to 2 decimal places.) Confidence interval to b. Using the confidence interval from Part (a), test if the ratio...
Consider the following data drawn independently from normally distributed populations: (You may find it useful to...
 Consider the following data drawn independently from normally distributed populations: (You may find it useful to reference the appropriate table: z table or t table) 21 = 29.8 012 - 95.3 nu = 34 22 = 32.4 oz? = 91.6 ng = 29 a. Construct the 99% confidence interval for the difference between the population means. (Negative values should be indicated by a minus sign. Round all intermediate calculations to at least 4 decimal places and final answers to 2...
Consider the following competing hypotheses and accompanying sample data drawn independently from normally distributed populations. (You may find it useful to reference the appropriate table: z table or t table)
 Consider the following competing hypotheses and accompanying sample data drawn independently from normally distributed populations. (You may find it useful to reference the appropriate table: z table or t table) H0: μ1 − μ2 = 0HA: μ1 − μ2 ≠ 0 x−1x−1 = 57x−2 = 63σ1 = 11.5σ2 = 15.2n1 = 20n2 = 20a-1. Calculate the value of the test statistic. (Negative values should be indicated by a minus sign. Round all intermediate calculations to at least 4 decimal places and final answer to 2 decimal places.)Test Statistic ?
 Consider the following data drawn independently from normally distributed populations: (You may find it useful to reference the appropriate table: z table or t table 31.6x2 26.8 σ12-91.9 σ22-90.0 120 2-26 a. Construct the 99% confidence interval for the difference between the population means Negative values should be indicated b, a minus sign. Round all intermediate calculations to at least 4 decimal places and final answers to 2 decimal places.) Confidence interval is to
 Consider the following data drawn independently from normally distributed populations: (You may find it useful to reference the appropriate table: z table or t table) *1 = -28.3 s12 = 8.7 ni = 22 X2 = -18.5 s 2 = 7.9 n2 = 16 a. Construct the 95% confidence interval for the difference between the population means. Assume the population variances are unknown but equal. (Round all intermediate calculations to at least 4 decimal places and final answers to 2...
 Return to question Consider the following data drawn independently from normally distributed populations: (You may find it useful to reference the appropriate table: z table or t table) X1 = 30.5 012 = 96.3 ni = 27. x2 = 24.7 022 = 93.1 n2 = 26 a. Construct the 95% confidence interval for the difference between the population means. (Negative values should be indicated by a minus sign. Round all intermediate calculations to at least 4 decimal places and final...
 Consider the following data drawn independently from normally distributed populations: (You may find it useful to reference the appropriate table: z table or t table) X1 = 27.1 012 = 89.5 n1 = 25 X2 = 30.3 022 = 92.3 n2 = 31 a. Construct the 90% confidence interval for the difference between the population means. (Negative values should be indicated by a minus sign. Round all intermediate calculations to at least 4 decimal places and final answers to 2...
 Consider the following measures based on independently drawn samples from normally distributed populations Ợou may find it useful to reference the appropriate table: chi-square table or F table) Sample 1: s 221, and n1 - 16 Sample 2:s 208, and n2 11 a. Construct the 95% interval estimate for the ratio of the population variances. (Round "F' value and final answers to 2 decimal places.) Confidence interval to b. Using the confidence interval from Part (a), test if the ratio...
 Consider the following data drawn independently from normally distributed populations: (You may find it useful to reference the appropriate table: z table or t table) 21 = 29.8 012 - 95.3 nu = 34 22 = 32.4 oz? = 91.6 ng = 29 a. Construct the 99% confidence interval for the difference between the population means. (Negative values should be indicated by a minus sign. Round all intermediate calculations to at least 4 decimal places and final answers to 2...
Most questions answered within 3 hours.
-
A 1,150 lumen light bulb is placed 37 cm in front of a mirrored
wall, whose...
asked 28 seconds from now -
Given that z is a standard normal random variable, compute the
following probabilities (to 4 decimals)....
asked 5 minutes ago -
You begin preparation of the calibration curve to measure
absorbance vs concentration of FeSCN2+. To do...
asked 23 minutes ago -
When you speak after breathing helium, in which the speed of
sound is much greater than...
asked 15 minutes ago -
3. Stock Valuation: You are the CEO of Under Armour, Inc. and
are thinking about how...
asked 20 minutes ago -
Choose a brand. Critique the brand in terms of its brand
positioning, brand identity and brand...
asked 22 minutes ago -
A vertical curve has grades G1 = 2.8% (downgrade) and
G2 = 2.2 (upgrade) Assume design...
asked 23 minutes ago -
(a) Derive planar density expressions for BCC
(110) plane in terms of the atomic radius R....
asked 18 minutes ago -
I have this problem now and I am not sure what we are exactly
supposed to...
asked 24 minutes ago -
Use the following set of observed frequencies to test the
independence of the two variables. Variable...
asked 47 minutes ago -
Two kg of ice at -15 °C are placed in a 2 kg bath of water...
asked 47 minutes ago -
Describe the following with suitable
examples.
1- Security Policy Heterogeneity
2-Security Model Heterogeneity
3-Security Mechanism Heterogeneity...
asked 48 minutes ago