Country Suicides/ 100,000 Guatemala 2.5 United Arab Emirates 2.9 Venezuela, RB 3 Algeria 3.1 Lebanon 3.1...
| Country | Suicides/ 100,000 | |
| Guatemala | 2.5 | |
| United Arab Emirates | 2.9 | |
| Venezuela, RB | 3 | |
| Algeria | 3.1 | |
| Lebanon | 3.1 | |
| Myanmar | 4.3 | |
| Greece | 4.3 | |
| Mexico | 5 | |
| Israel | 5.5 | |
| Tunisia | 5.5 | |
| Peru | 5.8 | |
| Malta | 6 | |
| Colombia | 6.1 | |
| Brazil | 6.3 | |
| Kenya | 6.5 | |
| Ghana | 6.9 | |
| Ecuador | 7.5 | |
| Italy | 7.9 | |
| Ethiopia | 8.4 | |
| Spain | 8.5 | |
| United Kingdom | 8.5 | |
| Turkey | 8.7 | |
| Burkina Faso | 9.2 | |
| Nicaragua | 9.5 | |
| China | 10 | |
| Norway | 10.9 | |
| Luxembourg | 11.1 | |
| Ireland | 11.7 | |
| Australia | 11.8 | |
| New Zealand | 11.9 | |
| Denmark | 12.2 | |
| Canada | 12.3 | |
| Netherlands | 12.6 | |
| Iceland | 13.1 | |
| Germany | 13.4 | |
| Portugal | 13.6 | |
| Argentina | 14.2 | |
| United States | 14.3 | |
| Switzerland | 15.1 | |
| Sweden | 15.4 | |
| India | 15.7 | |
| Finland | 16.2 | |
| Austria | 16.4 | |
| France | 16.9 | |
| Japan | 19.6 | |
| Belgium | 20.5 | |
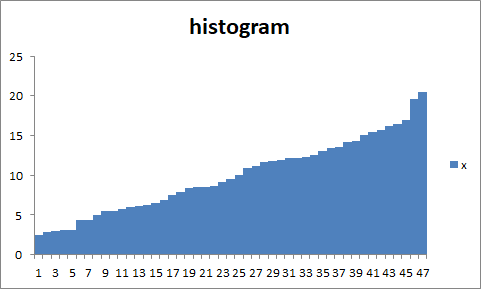
- Shape & Outliers. create a histogram and boxplot of the variable: suicide rates (per 100,000). Be sure to draw the boxplot horizontally and use fences to determine if the variable contains outliers. Describe the shape of the distribution.
The shape of this distribution is:
How many outliers does this distribution contain? < insert answer >
- Center & Spread. find the mean and standard deviation. Round your answers to the nearest thousandth.
Mean:
Standard Deviation:
- Is it Normal? In Statistics, it is reasonable to conclude that a variable follows a normal distribution if it’s shape is roughly symmetric (bell-shaped) with at most one outlier. Would it be reasonable to conclude that the suicide rates (per 100,000) for countries in the data table follow a normal distribution? Explain why or why not?
Homework Answers
Answer:
1) Histogram :
Using excel :
Path : Insert < charts < column
BOXPLOT:
Using MINITAB
Path : Graph< Boxplot

- From boxplot , outlier is not present in above data.
- From above histogram , the data are Left Skewed because most of values in data are clustered on the left side of the histogram. Data is increasing order.
2 ) From histogram we can say that , Shape of distribution does not contain outlier
3) Mean and Standard deviation
Using MInitab :
Path : stat < discriptive statistics
Mean = 9.917
standard deviation = 4.678
4) For Normal distribution histogram are symmetric . But here histogram is left skewed hence we conclude that the suicide rates (per 100,000) for countries in the data table not follow a normal distribution.
Add Answer to:
Country
Suicides/ 100,000
Guatemala
2.5
United Arab Emirates
2.9
Venezuela, RB
3
Algeria
3.1
Lebanon
3.1...
Most questions answered within 3 hours.
-
Blood pressure is normally taken on the upper arm at the level
of the heart. Suppose,...
asked 1 minute ago -
trust is best established through the combination of ------and
------- .
1. magnanimity and justice
2....
asked 2 minutes ago -
Calculate the [OH (aq)] in limes which have a [H3O*(aq)] of 1.3 x
10 mol/L
asked 2 minutes ago -
Suppose that the satellite around the earth has an orbit that is
24 KM larger in...
asked 4 minutes ago -
A nozzle with a radius of 0.250 cm is attached to a garden hose
with a...
asked 13 minutes ago -
PLEASE do not use any loops for the program; only recursion is
allowed
4. Write a...
asked 22 minutes ago -
Please help me with me. I did the first part to write the operations but in...
asked 19 minutes ago -
Use Cryptool to find the Cryptographic SHA-1 hash value of the
string "abc". The calculator is...
asked 23 minutes ago -
You are attempting to calculate a firm’s free cash flow to
equity. You know the following...
asked 1 hour ago -
the following reaction occurs in a balloon containing
N2O2 gas
N2O4(g)=2NO2(g)
will the volume of the...
asked 1 hour ago -
answer the questions throughout this program
public class Day implements Comparable {
Private Boolean atWork;...
asked 1 hour ago -
This is C++ code for parking fee management program
#include <iostream>
#include <iomanip>
using namespace std;...
asked 2 hours ago