Question text A study was conducted with vegetarians to see if the number of grams of...
Question text
A study was conducted
with vegetarians to see if the number of grams of protein each ate
per day was related to diastolic blood pressure. The data is given
below. What is the correlation coefficient of the regression line
that relates protein to diastolic pressurep.
Round to 3 decimals
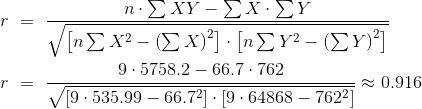
| grm protein | 4 | 6.5 | 5 | 5.5 | 8 | 10 | 9 | 8.2 | 10.5 |
| dias pressure | 73 | 79 | 83 | 82 | 84 | 92 | 88 | 86 | 95 |
Homework Answers
| X | Y | X⋅Y | X⋅X | Y⋅Y |
| 4 | 73 | 292 | 16 | 5329 |
| 6.5 | 79 | 513.5 | 42.25 | 6241 |
| 5 | 83 | 415 | 25 | 6889 |
| 5.5 | 82 | 451 | 30.25 | 6724 |
| 8 | 84 | 672 | 64 | 7056 |
| 10 | 92 | 920 | 100 | 8464 |
| 9 | 88 | 792 | 81 | 7744 |
| 8.2 | 86 | 705.2 | 67.24 | 7396 |
| 10.5 | 95 | 997.5 | 110.25 | 9025 |
 |
 |
 |
 |
 |
Add Answer to:
Question text
A study was conducted
with vegetarians to see if the number of grams of...
A study was conducted with vegetarians to see whether the number of grams of protein each...
 A study was conducted with vegetarians to see whether the number of grams of protein each ate per day was related to diastolic blood pressure. The data are given here. Grams x Pressure y 4 6.5 5 5.5 8 10 9 8.2 73 79 83 82 84 92 88 86 10.5 95 1. Plot the data points on graph paper. 2. Compute and interpret the coefficient of correlation between the Grams (x) and Pressure (y). 3. Conduct a "4" test...
A study was conducted with vegetarians to see whether the number of grams of protein each...
 A study was conducted with vegetarians to see whether the number of grams of protein each ate per day was related to diastolic blood pressure. The data are given here. Is there sufficient evidence to conclude that there is a linear correlation between protein intake (grams, x) and diastolic blood pressure (pressure, y)? Fill in the missing blanks for the table given. Grams (ar) Grams Pressure (2. y Pressure (y Grams? (2) Pressure (y) 292 5329 513.5 42.25 6241 25...
The laboratory performed a comparison study of LDL-c values in 40 participants (40 samples are split...
 The laboratory performed a comparison study of LDL-c values in 40 participants (40 samples are split so are considered matched or pairs) using two different analyzers, the Abbott and the Roche. The Abbott is considered the gold standard method used in many facilities and the Roche is new and of interest due to faster turn-around time and economical factors. The purpose of the comparison study is to determine if there is a significant difference in results by the two methods...
Student stress at final exam time comes partly from the uncertainty of grades and the consequence...
 Student stress at final exam time comes partly from the
uncertainty of grades and the consequences of those grades. Can
knowledge of a midterm grade be used to predict a final exam grade?
A random sample of 200 BCOM students from recent years was taken
and their percentage grades on assignments, midterm exam, and final
exam were recorded. Let’s examine the ability of midterm and
assignment grades to predict final exam grades.
The data are shown here:
Assignment
Midterm
FinalExam...
Student stress at final exam time comes partly from the
uncertainty of grades and the consequences of those grades. Can
knowledge of a midterm grade be used to predict a final exam grade?
A random sample of 200 BCOM students from recent years was taken
and their percentage grades on assignments, midterm exam, and final
exam were recorded. Let’s examine the ability of midterm and
assignment grades to predict final exam grades.
The data are shown here:
Assignment
Midterm
FinalExam...
Problem 8.4: Refer to Muscle Mass Problem 1.27. Second-order regression model (8.2) with independent normal error...
Problem 8.4: Refer to Muscle Mass Problem 1.27. Second-order regression model (8.2) with independent normal error terms is expected to be appropriate. A. Fit regression model (8.2). Plot the fitted regression function and the data. Does the quadratic regression function appear to be a good fit here? Find R^2. B. Test whether or not there is regression relation; use α= .05. State the alternatives, decision rule and conclusion. C. Estimate the mean muscle mass for women aged 48...
having trouble with this one Previous Problem List Next 1 point) A study is conducted to...
 having trouble with this one
Previous Problem List Next 1 point) A study is conducted to determine if a newly designed text book is more helpful to learning the material than the old edition. The mean score on the final exam for a course using the old edition is 75. Ten randomly selected people who used the new text took the final exam. Their scores are shown in the table below. Person ABCDEFGHIJ Test Score 73 95 86 82 88...
having trouble with this one
Previous Problem List Next 1 point) A study is conducted to determine if a newly designed text book is more helpful to learning the material than the old edition. The mean score on the final exam for a course using the old edition is 75. Ten randomly selected people who used the new text took the final exam. Their scores are shown in the table below. Person ABCDEFGHIJ Test Score 73 95 86 82 88...
Midterm1 = (83.33, 98.33, 75, 91.67, 96.67, 95, 86.67, 65, 100, 100, 80, 88.33, 96.67, 96.67,...
 Midterm1 = (83.33, 98.33, 75, 91.67, 96.67, 95, 86.67, 65, 100,
100, 80, 88.33,
96.67, 96.67, 90, 96.67, 86.67, 93.33, 80, 91.67, 98.33, 86.67, 85,
86.67, 95,
83.33, 96.67, 81.67, 98.33, 100, 95, 93.33, 91.67, 88.33, 98.33,
93.33, 98.33,
93.33, 85, 88.33, 100, 98.33, 96.67, 90, 86.67, 100, 96.67, 98.33,
90, 96.67,
86.67, 95, 78.33, 86.67, 100, 81.67, 96.67, 91.67, 96.67, 96.67,
95, 96.67, 73.33,
100, 93.33, 96.67, 88.33, 70, 96.67, 96.67, 100, 88.33, 96.67, 100,
88.33, 100,
78.33, 93.33,...
Midterm1 = (83.33, 98.33, 75, 91.67, 96.67, 95, 86.67, 65, 100,
100, 80, 88.33,
96.67, 96.67, 90, 96.67, 86.67, 93.33, 80, 91.67, 98.33, 86.67, 85,
86.67, 95,
83.33, 96.67, 81.67, 98.33, 100, 95, 93.33, 91.67, 88.33, 98.33,
93.33, 98.33,
93.33, 85, 88.33, 100, 98.33, 96.67, 90, 86.67, 100, 96.67, 98.33,
90, 96.67,
86.67, 95, 78.33, 86.67, 100, 81.67, 96.67, 91.67, 96.67, 96.67,
95, 96.67, 73.33,
100, 93.33, 96.67, 88.33, 70, 96.67, 96.67, 100, 88.33, 96.67, 100,
88.33, 100,
78.33, 93.33,...
Compute the correlation coefficient, r, for all five variables (columns). Interpret your findings whether you have determined any relationship between variables. X1 X2 X3 X4 X5 The data (X1, X...
Compute the correlation coefficient, r, for all five variables (columns). Interpret your findings whether you have determined any relationship between variables. X1 X2 X3 X4 X5 The data (X1, X2, X3, X4, X5) are by city. 8 78 284 9.1 109 X1 = death rate per 1000 residents 9.3 68 433 8.7 144 X2 = doctor availability per 100,000 residents 7.5 70 739 7.2 113 X3 = hospital availability per 100,000 residents 8.9 96 1792 8.9 97 X4 = annual...
Compute Regression Analysis for following relationship: The relationship between death rate X1 (USD) vs. population density...
Compute Regression Analysis for following relationship: The relationship between death rate X1 (USD) vs. population density X5. Population as a Predictor, X, then death rate as a Response variable, Y. Get Regression Output, and Scatter plot between these variables and compute Coefficient of Determination, R2, and Interpret your findings. X1 X2 X3 X4 X5 The data (X1, X2, X3, X4, X5) are by city. 8 78 284 9.1 109 X1 = death rate per 1000 residents 9.3 68 433 8.7 144...
all the answers must be done please help and codes should be done in matlab Part C (Based off week 12 workshop...
 all the answers must be done please help and codes should be
done in matlab
Part C (Based off week 12 workshop content Sinee the implementation of the CityCyele scheme in October 2010, the Bris bane council has recorded the mamber of City Cycle trips every month The results are available in the CityCycleData.cov' fie on Blackboard 1. Import the data into MATLAB using the cavread fuaction, and the visualise the data with the scatter function Coenment on whether a...
all the answers must be done please help and codes should be
done in matlab
Part C (Based off week 12 workshop content Sinee the implementation of the CityCyele scheme in October 2010, the Bris bane council has recorded the mamber of City Cycle trips every month The results are available in the CityCycleData.cov' fie on Blackboard 1. Import the data into MATLAB using the cavread fuaction, and the visualise the data with the scatter function Coenment on whether a...
 A study was conducted with vegetarians to see whether the number of grams of protein each ate per day was related to diastolic blood pressure. The data are given here. Grams x Pressure y 4 6.5 5 5.5 8 10 9 8.2 73 79 83 82 84 92 88 86 10.5 95 1. Plot the data points on graph paper. 2. Compute and interpret the coefficient of correlation between the Grams (x) and Pressure (y). 3. Conduct a "4" test...
 A study was conducted with vegetarians to see whether the number of grams of protein each ate per day was related to diastolic blood pressure. The data are given here. Is there sufficient evidence to conclude that there is a linear correlation between protein intake (grams, x) and diastolic blood pressure (pressure, y)? Fill in the missing blanks for the table given. Grams (ar) Grams Pressure (2. y Pressure (y Grams? (2) Pressure (y) 292 5329 513.5 42.25 6241 25...
 The laboratory performed a comparison study of LDL-c values in 40 participants (40 samples are split so are considered matched or pairs) using two different analyzers, the Abbott and the Roche. The Abbott is considered the gold standard method used in many facilities and the Roche is new and of interest due to faster turn-around time and economical factors. The purpose of the comparison study is to determine if there is a significant difference in results by the two methods...
 Student stress at final exam time comes partly from the
uncertainty of grades and the consequences of those grades. Can
knowledge of a midterm grade be used to predict a final exam grade?
A random sample of 200 BCOM students from recent years was taken
and their percentage grades on assignments, midterm exam, and final
exam were recorded. Let’s examine the ability of midterm and
assignment grades to predict final exam grades.
The data are shown here:
Assignment
Midterm
FinalExam...
Student stress at final exam time comes partly from the
uncertainty of grades and the consequences of those grades. Can
knowledge of a midterm grade be used to predict a final exam grade?
A random sample of 200 BCOM students from recent years was taken
and their percentage grades on assignments, midterm exam, and final
exam were recorded. Let’s examine the ability of midterm and
assignment grades to predict final exam grades.
The data are shown here:
Assignment
Midterm
FinalExam...
 having trouble with this one
Previous Problem List Next 1 point) A study is conducted to determine if a newly designed text book is more helpful to learning the material than the old edition. The mean score on the final exam for a course using the old edition is 75. Ten randomly selected people who used the new text took the final exam. Their scores are shown in the table below. Person ABCDEFGHIJ Test Score 73 95 86 82 88...
having trouble with this one
Previous Problem List Next 1 point) A study is conducted to determine if a newly designed text book is more helpful to learning the material than the old edition. The mean score on the final exam for a course using the old edition is 75. Ten randomly selected people who used the new text took the final exam. Their scores are shown in the table below. Person ABCDEFGHIJ Test Score 73 95 86 82 88...
 Midterm1 = (83.33, 98.33, 75, 91.67, 96.67, 95, 86.67, 65, 100,
100, 80, 88.33,
96.67, 96.67, 90, 96.67, 86.67, 93.33, 80, 91.67, 98.33, 86.67, 85,
86.67, 95,
83.33, 96.67, 81.67, 98.33, 100, 95, 93.33, 91.67, 88.33, 98.33,
93.33, 98.33,
93.33, 85, 88.33, 100, 98.33, 96.67, 90, 86.67, 100, 96.67, 98.33,
90, 96.67,
86.67, 95, 78.33, 86.67, 100, 81.67, 96.67, 91.67, 96.67, 96.67,
95, 96.67, 73.33,
100, 93.33, 96.67, 88.33, 70, 96.67, 96.67, 100, 88.33, 96.67, 100,
88.33, 100,
78.33, 93.33,...
Midterm1 = (83.33, 98.33, 75, 91.67, 96.67, 95, 86.67, 65, 100,
100, 80, 88.33,
96.67, 96.67, 90, 96.67, 86.67, 93.33, 80, 91.67, 98.33, 86.67, 85,
86.67, 95,
83.33, 96.67, 81.67, 98.33, 100, 95, 93.33, 91.67, 88.33, 98.33,
93.33, 98.33,
93.33, 85, 88.33, 100, 98.33, 96.67, 90, 86.67, 100, 96.67, 98.33,
90, 96.67,
86.67, 95, 78.33, 86.67, 100, 81.67, 96.67, 91.67, 96.67, 96.67,
95, 96.67, 73.33,
100, 93.33, 96.67, 88.33, 70, 96.67, 96.67, 100, 88.33, 96.67, 100,
88.33, 100,
78.33, 93.33,...
 all the answers must be done please help and codes should be
done in matlab
Part C (Based off week 12 workshop content Sinee the implementation of the CityCyele scheme in October 2010, the Bris bane council has recorded the mamber of City Cycle trips every month The results are available in the CityCycleData.cov' fie on Blackboard 1. Import the data into MATLAB using the cavread fuaction, and the visualise the data with the scatter function Coenment on whether a...
all the answers must be done please help and codes should be
done in matlab
Part C (Based off week 12 workshop content Sinee the implementation of the CityCyele scheme in October 2010, the Bris bane council has recorded the mamber of City Cycle trips every month The results are available in the CityCycleData.cov' fie on Blackboard 1. Import the data into MATLAB using the cavread fuaction, and the visualise the data with the scatter function Coenment on whether a...
Most questions answered within 3 hours.
-
2) Write a C++ program that uses a class called “Degree” to
obtain the trigonometric
values...
asked 33 minutes ago -
1. In eukaryotic cells the genomes of
&
asked 32 minutes ago -
The standard enthalpy of propanol (C3H7OH) is -303.0 kJ/mol.
Compute both of the
gross and net...
asked 32 minutes ago -
Why PWM using H-bridge for control motor speed is more power
effiecient than the linear amplifier...
asked 46 minutes ago -
In 1999, Carly Fiorina famously said,"I hope that we are at a
point that everyone is...
asked 49 minutes ago -
Individuals in a species of moth vary in wing color from white to
black, but all...
asked 1 hour ago -
The following standards for variable manufacturing overhead have
been established for a company that makes only...
asked 1 hour ago -
The United States government wanted to determine what proportion
of Americans approve of the current president,...
asked 1 hour ago -
2-N stone is dropped from the top of a cliff. The stone hits the
ground 3...
asked 1 hour ago -
Vitamins participate in metabolic reactions in their coenzyme
forms . Match the following reactions to the respective...
asked 1 hour ago -
We have developed a new mobile device and wish to gain insight
into the price that...
asked 1 hour ago -
12.8 ml of a solution is run into an empty flask, from a buret.
The mass...
asked 1 hour ago