XYZ corporation uses statistical quality control to monitor the quality of their product. They have determined...
XYZ corporation uses statistical quality control to monitor the
quality of their product. They have determined the process average,
representing the population proportion defective, is 0.02, and size
of the samples is 100 units. (3 pts each)
a). In constructing a p-chart using 3-sigma limits, what is the
UCL?
b). In constructing a p-chart using 3-sigma limits, what is the
LCL?
c). Discuss what would happen if one of the sample values is
0.085.
Homework Answers
P charts are charts used in statistical quality control and to monitor the proportion of non confirming parts in a sample.
Population proportion defective is 0.02
Size of Sample units is 100
Part A
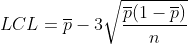
The Upper Control Limit for the p charts is given as

where
 is
average proportion defective i.e. 0.02
is
average proportion defective i.e. 0.02
n is the sample size
so the UCL is calculated as below


Part B
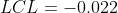
The Lower Control Limit for the p charts is given as
where
is
average proportion defective i.e. 0.02
n is the sample size
so the LCL is calculated as below

Part C
If one of sample values are 0.085 then it means the sample falls out side the Control limits (on the higher side)
Thus it means that the process is out of control in the case of this sample.
Add Answer to:
XYZ corporation uses statistical quality control to monitor the
quality of their product. They have determined...
a production process is considered in control if up to 4% of items produced are defective. samples of size 100 are used for the inspection process. determine the upper and lower control limits for the...
a production process is considered in control if up to 4% of items produced are defective. samples of size 100 are used for the inspection process. determine the upper and lower control limits for the p chart. A. UCL= .0988 LCL=0.0000 B. UCL=.0888 LCL= 0.000 C. UCL= .0788 LCL= .01 D. UCL= 0.0688 LCL= .02
eBook Twenty-Six samples of 110 items each were inspected when a process was considered to be...
 eBook Twenty-Six samples of 110 items each were inspected when a process was considered to be operating satisfactorily. In the 26 samples, a total of 135items were found to be defective. a. What is an estimate of the proportion defective when the process is in control? Round your answer to four decimal places. p= b. What is the standard error of the proportion if samples of size 110 will be used for statistical process control? Round your answer to four...
f dustless chalk Instituted a quality control program A manufacturer o monitor chalk density. The sample standard devia...
 f dustless chalk Instituted a quality control program A manufacturer o monitor chalk density. The sample standard deviations of densities for 24 different subgroups, each consisting of n 8 chalk specimens, were as follows: This data has been coded so that you may copy and paste it into R with the name k.sdevs. k.sdevs c(0.207, 0.313, 0.097, 0.186, 0.233, 0.209, 0.319, 0.290, 0.143 0.212, 0.054, 0.146, 0.274, 0.348, 0.161, 0.216, 0.090, 0.056) 0.152, 0.231, 0.274, 0.121, 0.385, 0.188. mean(k.sdevs) #...
Twenty samples of 100 items each were inspected when a process was considered to be operating...
Twenty samples of 100 items each were inspected when a process was considered to be operating satisfactorily. In the 20 samples, a total of 135 items were found to be defective. (a) What is an estimate of the proportion defective when the process is in control? (b) What is the standard error of the proportion if samples of size 100 will be used for statistical process control? (Round your answer to four decimal places.) (c)Compute the upper and lower control...
A manufacturer of dustless chalk instituted a quality control program to monitor chalk density. The sample standard dev...
 A manufacturer of dustless chalk instituted a quality control program to monitor chalk density. The sample standard deviations of densities for 24 different subgroups, each consisting of n 8 chalk specimens, were as follows: This data has been coded so that you may copy and paste it into R with the name k.sdevs. k.sdevs c(0.202, 0.315, 0.097, 0.182, 0.229, 0.215, 0.320, 0.288, 0.146, 0.208, 0.050, 0.145, 0.269, 0.350, 0.158. 0.215, 0.386, 0.187, 0.151, 0.231, 0.275, 0.117, 0.091, 0.059) mean(k.sdevs) #Construct...
A company that makes car parts. The company control its production process by periodically taking a...
A company that makes car parts. The company control its production process by periodically taking a sample of 100 units from the production line. Each product is inspected for defective features. Control limits are developed using three standard deviations from the mean as the limit. During the last 12 samples taken, the proportion of defective items per sample was recorded as follows: 0.01 0.01 0.0 0.04 0.01 0.01 0.00 0.01 0.02 0.02 0.03 0.03 a. Determine the mean proportion defective,...
Twenty samples of 100 items each were inspected when a process was considered to be operating...
Twenty samples of 100 items each were inspected when a process was considered to be operating satisfactorily. In the 20 samples, a total of 130 items were found to be defective. (a) What is an estimate of the proportion defective when the process is in control? (Round your answer to four decimal places.) (b) What is the standard error of the proportion if samples of size 100 will be used for statistical process control? (Round your answer to four decimal...
U-learn University uses a c-chart to monitor student complaints per week. Complaints have been recorded over...
 U-learn University uses a c-chart to monitor student complaints per week. Complaints have been recorded over the past ten weeks. Develop 3-sigma control limits using the following data: Week Number of Complaints (If the lower control limit is negative, round the LCL to zero and all other answers to 2 decimal places, e.g. 15.25.) UCL
A manufacturer of dustless chalk instituted a quality control program to monitor chalk density. The sample standard dev...
 A manufacturer of dustless chalk instituted a quality control program to monitor chalk density. The sample standard deviations of densities for 24 different subgroups, each consisting of n 8 chalk specimens, were as follows into R with the name k.sdevs. This data has been coded so that you may copy and paste .sdevs c(0.204, 0.317, 0.096, 0.184, 0.233, 0.214, 0.324, 0.287, 0.148, 0.209, 0.053, 0.147, 0.273, 0.348, 0.158, 0.213, 0.390 0.184, 0.150, 0.226, 0.274, 0.121, 0.094, 0.058) mean(k.sdevs) Construct your...
Upper Control Limit pchart
William Industries has decided to use a p-chart with 3-sigma control limits to monitor the proportion of defective galvanized pipes produced by their production process. The operations manager randomly samples 250 galvanized pipes at 10 successivley selected time periods and counts the number of defective galvanized pipes in the sample. What is the Upper Control Limit?
 eBook Twenty-Six samples of 110 items each were inspected when a process was considered to be operating satisfactorily. In the 26 samples, a total of 135items were found to be defective. a. What is an estimate of the proportion defective when the process is in control? Round your answer to four decimal places. p= b. What is the standard error of the proportion if samples of size 110 will be used for statistical process control? Round your answer to four...
 f dustless chalk Instituted a quality control program A manufacturer o monitor chalk density. The sample standard deviations of densities for 24 different subgroups, each consisting of n 8 chalk specimens, were as follows: This data has been coded so that you may copy and paste it into R with the name k.sdevs. k.sdevs c(0.207, 0.313, 0.097, 0.186, 0.233, 0.209, 0.319, 0.290, 0.143 0.212, 0.054, 0.146, 0.274, 0.348, 0.161, 0.216, 0.090, 0.056) 0.152, 0.231, 0.274, 0.121, 0.385, 0.188. mean(k.sdevs) #...
 A manufacturer of dustless chalk instituted a quality control program to monitor chalk density. The sample standard deviations of densities for 24 different subgroups, each consisting of n 8 chalk specimens, were as follows: This data has been coded so that you may copy and paste it into R with the name k.sdevs. k.sdevs c(0.202, 0.315, 0.097, 0.182, 0.229, 0.215, 0.320, 0.288, 0.146, 0.208, 0.050, 0.145, 0.269, 0.350, 0.158. 0.215, 0.386, 0.187, 0.151, 0.231, 0.275, 0.117, 0.091, 0.059) mean(k.sdevs) #Construct...
 U-learn University uses a c-chart to monitor student complaints per week. Complaints have been recorded over the past ten weeks. Develop 3-sigma control limits using the following data: Week Number of Complaints (If the lower control limit is negative, round the LCL to zero and all other answers to 2 decimal places, e.g. 15.25.) UCL
 A manufacturer of dustless chalk instituted a quality control program to monitor chalk density. The sample standard deviations of densities for 24 different subgroups, each consisting of n 8 chalk specimens, were as follows into R with the name k.sdevs. This data has been coded so that you may copy and paste .sdevs c(0.204, 0.317, 0.096, 0.184, 0.233, 0.214, 0.324, 0.287, 0.148, 0.209, 0.053, 0.147, 0.273, 0.348, 0.158, 0.213, 0.390 0.184, 0.150, 0.226, 0.274, 0.121, 0.094, 0.058) mean(k.sdevs) Construct your...
Most questions answered within 3 hours.
-
Starting with benzene, synthesize 1-phenyl-1-butyne.
Show intermediates and reagents.
asked 24 minutes ago -
Create a 32-run crossed array design with six control factors
and two noise factors such that...
asked 1 hour ago -
A 500g sample of sand from source A has the following amounts
retained on each sieve....
asked 1 hour ago -
In
your own words, please explain the essay by John Keynes wrote "The
End of Laissez...
asked 1 hour ago -
How are the matrix and pixels related? Why are smaller
pixels better for diagnostic quality?
asked 1 hour ago -
2. An AC generator has 80 rectangular loops on
its armature. Each loop is 11 cm...
asked 1 hour ago -
Please help me with this question. Consider Aldi’s current and
potential geographic markets (see Exhibit 4...
asked 1 hour ago -
What are the main components of the fermentation process and
give an explanation of each? Include...
asked 1 hour ago -
Explain which types of cells in the body (belonging to which
organs, etc.) are sensitive to...
asked 1 hour ago -
A single cable supports an 703-kg elevator car. What is the
tension in the cable when...
asked 1 hour ago -
among the three different ways to link CSS specifications to an
HTML document (inline CSS, document...
asked 2 hours ago -
(1) Write the net ionic equation for the reaction that occurs
when equal volumes of 0.191...
asked 2 hours ago