| Emergency Condition | ||||
| Display Panel | 1 | 2 | 3 | 4 |
| A | 18 | 26 | 33 | 14 |
| 18 | 26 | 36 | 14 | |
| B | 15 | 22 | 30 | 12 |
| 11 | 18 | 31 | 5 | |
| C | 22 | 28 | 35 | 10 |
| 23 | 32 | 38 | 15 | |
| Two-way ANOVA: Time versus Panel, Condition | |||||
| Source | DF | SS | MS | F | P |
| Panel | 2 | 144.542 | 144.542 | 25.32 | .0000 |
| Condition | 3 | 1,647.12 | 549.042 | 96.18 | .0000 |
| Interaction | 6 | 24.25 | 4.042 | .71 | .6498 |
| Error | 12 | 68.50 | 5.708 | ||
| Total | 23 | 2,028.96 | |||
| Tabulated statistics: Panel, Condition | |||||
| Rows: | Panel | Columns: | Condition | ||
| 1 | 2 | 3 | 4 | All | |
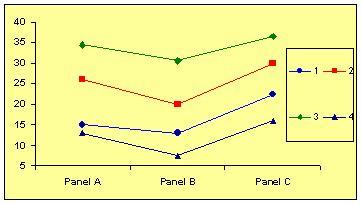
| A | 15.00 | 26.00 | 34.50 | 13.00 | 22.13 |
| B | 13.00 | 20.00 | 30.50 | 7.50 | 17.75 |
| C | 22.50 | 30.00 | 36.50 | 16.00 | 26.25 |
| All | 17.67 | 25.33 | 33.83 | 12.17 | 22.04 |
(e) Make pairwise comparisons of emergency conditions 1, 2, 3, and 4 by using Tukey simultaneous 95 percent confidence intervals. (Round your answers to 2 decimal places. Negative amounts should be indicated by a minus sign.)
| u1 – u2: | [ , ] | |
| u1 – u3: | [ , ] | |
| u1 – u4: | [ , ] | |
| u2 – u3: | [ , ] | |
| u2 – u4: | [ , ] | |
| u3 – u4: | [ , ] | |
(f) Which display panel minimizes the time required to stabilize an emergency condition? Does your answer depend on the emergency condition? Why?
|
(Click to select)Panel APanel BPanel C minimizes the time required
to stabilize an emergency condition. (Click to select)YesNo, there is (Click to select)someno interaction. |
(g) Calculate a 95 percent (individual) confidence interval for the mean time required to stabilize emergency condition 4 using display panel B. (Round your answers to 2 decimal places.)
Confidence interval [ , ]
Homework Answers
Answer:
MINITAB used.
The ANOVA results are different for this given data.
Analysis of Variance
|
Source |
DF |
Adj SS |
Adj MS |
F-Value |
P-Value |
|
Panel |
2 |
228.58 |
114.292 |
19.32 |
0.000 |
|
condition |
3 |
1651.00 |
550.333 |
93.01 |
0.000 |
|
Panel*condition |
6 |
32.75 |
5.458 |
0.92 |
0.512 |
|
Error |
12 |
71.00 |
5.917 |
||
|
Total |
23 |
1983.33 |
(e) Make pairwise comparisons of emergency conditions 1, 2, 3, and 4 by using Tukey simultaneous 95 percent confidence intervals. (Round your answers to 2 decimal places. Negative amounts should be indicated by a minus sign.)
Tukey Simultaneous Tests for Differences of Means
|
Difference |
Difference |
SE of |
Simultaneous |
T-Value |
Adjusted |
|
2 - 1 |
7.50 |
1.40 |
(3.33, 11.67) |
5.34 |
0.001 |
|
3 - 1 |
16.00 |
1.40 |
(11.83, 20.17) |
11.39 |
0.000 |
|
4 - 1 |
-6.17 |
1.40 |
(-10.34, -2.00) |
-4.39 |
0.004 |
|
3 - 2 |
8.50 |
1.40 |
(4.33, 12.67) |
6.05 |
0.000 |
|
4 - 2 |
-13.67 |
1.40 |
(-17.84, -9.50) |
-9.73 |
0.000 |
|
4 - 3 |
-22.17 |
1.40 |
(-26.34, -18.00) |
-15.78 |
0.000 |
Individual confidence level = 98.83%
|
u1 – u2: |
[-11.67 ,-3.33 ] |
|
|
u1 – u3: |
[-20.17,-11.83 ] |
|
|
u1 – u4: |
[2.00 , 10.34 ] |
|
|
u2 – u3: |
[ -12.67, -4.33 ] |
|
|
u2 – u4: |
[9.50 ,17.84 ] |
|
|
u3 – u4: |
[ 18.00, 26.34 ] |
|
(f) Which display panel minimizes the time required to stabilize an emergency condition? Does your answer depend on the emergency condition? Why?
|
(Click to select)Panel BPanel minimizes the time
required to stabilize an emergency condition. |
(g) Calculate a 95 percent (individual) confidence interval for the mean time required to stabilize emergency condition 4 using display panel B. (Round your answers to 2 decimal places.)
Confidence interval [ -7.19, 24.19 ]
Mean=8.5 and se= 7.2
T table value at 0.05 level=2.179
Lower limit= 8.5-2.179*7.2 = -7.1888
upper limit= 8.5+2.179*7.2 = 24.1888
Means
|
Term |
Fitted |
SE Mean |
|
Panel |
||
|
A |
23.125 |
0.860 |
|
B |
18.000 |
0.860 |
|
C |
25.375 |
0.860 |
|
condition |
||
|
1 |
17.833 |
0.993 |
|
2 |
25.333 |
0.993 |
|
3 |
33.833 |
0.993 |
|
4 |
11.667 |
0.993 |
|
Panel*condition |
||
|
A 1 |
18.00 |
1.72 |
|
A 2 |
26.00 |
1.72 |
|
A 3 |
34.50 |
1.72 |
|
A 4 |
14.00 |
1.72 |
|
B 1 |
13.00 |
1.72 |
|
B 2 |
20.00 |
1.72 |
|
B 3 |
30.50 |
1.72 |
|
B 4 |
8.50 |
1.72 |
|
C 1 |
22.50 |
1.72 |
|
C 2 |
30.00 |
1.72 |
|
C 3 |
36.50 |
1.72 |
|
C 4 |
12.50 |
1.72 |
Add Answer to:
Emergency Condition Display Panel 1 2 3 4 A 18 26 33 14 18 26 36 14 B 15 22 30 12 11 ...
Ages Number of students 15-18 19-22 23-26 27-30 31-34 35-38 2 4. 9 6i 3 Based...
 Ages Number of students 15-18 19-22 23-26 27-30 31-34 35-38 2 4. 9 6i 3 Based on the frequency distribution above, is 4 a: OUpper class limit Class boundary Lower class limit Class midpoint Class width
PLEASE HELP 25. The following figure shows the dynamics of a TCP congestion window. (8 points) 45 40 35 s 30 3 25 20 0 2 4 6 8 10 12 14 16 18 20 22 24 26 Transmission round i) What is the initial...
 PLEASE HELP
25. The following figure shows the dynamics of a TCP congestion window. (8 points) 45 40 35 s 30 3 25 20 0 2 4 6 8 10 12 14 16 18 20 22 24 26 Transmission round i) What is the initial threshold? d at the t transmission round that caused the congestion window to change from exponential growh to linear i) What happerned growth? ii) What kind of loss occurred at the 16 transmission round that...
PLEASE HELP
25. The following figure shows the dynamics of a TCP congestion window. (8 points) 45 40 35 s 30 3 25 20 0 2 4 6 8 10 12 14 16 18 20 22 24 26 Transmission round i) What is the initial threshold? d at the t transmission round that caused the congestion window to change from exponential growh to linear i) What happerned growth? ii) What kind of loss occurred at the 16 transmission round that...
bottom question multiple choice options: 1. a. $18 b. $30 c. $12 d. $24 2. a. $9.13 b.$14.18 c. $10.63 d. $15.75 3. a.$20.44 b. $17.37 c. $11.53 d. $13.03 4. a.$5,276,250 b. $14,400,000 c. $3,75...
 bottom question multiple choice options:
1. a. $18 b. $30 c. $12 d. $24
2. a. $9.13 b.$14.18 c. $10.63 d. $15.75
3. a.$20.44 b. $17.37 c. $11.53 d. $13.03
4. a.$5,276,250 b. $14,400,000 c. $3,750,000 d.
$3,858,750
5. a. $$19,363,125 b. $6,693,281 c. $4,687,500 d.
$16,668,281
6. correct/incorrect
7. all/all but one
2. Income statement The income statement, also known as the profit and loss (P&l) statoment, provides a snapshot of the financial performance of a company during a...
bottom question multiple choice options:
1. a. $18 b. $30 c. $12 d. $24
2. a. $9.13 b.$14.18 c. $10.63 d. $15.75
3. a.$20.44 b. $17.37 c. $11.53 d. $13.03
4. a.$5,276,250 b. $14,400,000 c. $3,750,000 d.
$3,858,750
5. a. $$19,363,125 b. $6,693,281 c. $4,687,500 d.
$16,668,281
6. correct/incorrect
7. all/all but one
2. Income statement The income statement, also known as the profit and loss (P&l) statoment, provides a snapshot of the financial performance of a company during a...
17 18 12 13 15 16 5 14 2 3 4 6 7 10 11 1 He 1 H 2 N O F Ne Li Be Na Mg $3 Si CI Ar Al Cr Mn Fe Co Ca Sc Ni Cu Zn 4...
 17 18 12 13 15 16 5 14 2 3 4 6 7 10 11 1 He 1 H 2 N O F Ne Li Be Na Mg $3 Si CI Ar Al Cr Mn Fe Co Ca Sc Ni Cu Zn 4 K Ti V Ga Ge As Se Br Kr Sr Y Zr Nb Mo Tc Ru Rh Pd Ag Cd In Sn Sb Te 5 Rb Xe 6 Cs Ba La WRe Os Ir Au Hg TI...
TABLE B.2 Future Value of 1 Rate 2% 3% 5% 6% 7% 8% 0% 12% 15%...
 TABLE B.2 Future Value of 1 Rate 2% 3% 5% 6% 7% 8% 0% 12% 15% 1.0000 0000 1.1000 1200 1.2100 12544 1.0303 1.0612 1.0927 1249 1.1576 1.1910 1.2250 1.2597 1290 13310 1.4049 1.5735 1.6105 1.7623 1.0000 1.0000 1.0000 1.0000 1.0000 1.0000 1.0000 1.0000 1.0000 1.0100 .0200 1.0300 1.0400 0500 1.0201 .0404 1.0609 1.0816 1.1025 11236 .1449 .1664 1.1881 1.0700 1.0800 1.0900 1.0406 .0824 1.1255 11699 1.2155 1.2625 .3108 3605 1.4116 1.0510 1.1041 .1593 1.2167 1.2763 1.3382 .4026 1.4693 5386...
 Ages Number of students 15-18 19-22 23-26 27-30 31-34 35-38 2 4. 9 6i 3 Based on the frequency distribution above, is 4 a: OUpper class limit Class boundary Lower class limit Class midpoint Class width
 PLEASE HELP
25. The following figure shows the dynamics of a TCP congestion window. (8 points) 45 40 35 s 30 3 25 20 0 2 4 6 8 10 12 14 16 18 20 22 24 26 Transmission round i) What is the initial threshold? d at the t transmission round that caused the congestion window to change from exponential growh to linear i) What happerned growth? ii) What kind of loss occurred at the 16 transmission round that...
PLEASE HELP
25. The following figure shows the dynamics of a TCP congestion window. (8 points) 45 40 35 s 30 3 25 20 0 2 4 6 8 10 12 14 16 18 20 22 24 26 Transmission round i) What is the initial threshold? d at the t transmission round that caused the congestion window to change from exponential growh to linear i) What happerned growth? ii) What kind of loss occurred at the 16 transmission round that...
 bottom question multiple choice options:
1. a. $18 b. $30 c. $12 d. $24
2. a. $9.13 b.$14.18 c. $10.63 d. $15.75
3. a.$20.44 b. $17.37 c. $11.53 d. $13.03
4. a.$5,276,250 b. $14,400,000 c. $3,750,000 d.
$3,858,750
5. a. $$19,363,125 b. $6,693,281 c. $4,687,500 d.
$16,668,281
6. correct/incorrect
7. all/all but one
2. Income statement The income statement, also known as the profit and loss (P&l) statoment, provides a snapshot of the financial performance of a company during a...
bottom question multiple choice options:
1. a. $18 b. $30 c. $12 d. $24
2. a. $9.13 b.$14.18 c. $10.63 d. $15.75
3. a.$20.44 b. $17.37 c. $11.53 d. $13.03
4. a.$5,276,250 b. $14,400,000 c. $3,750,000 d.
$3,858,750
5. a. $$19,363,125 b. $6,693,281 c. $4,687,500 d.
$16,668,281
6. correct/incorrect
7. all/all but one
2. Income statement The income statement, also known as the profit and loss (P&l) statoment, provides a snapshot of the financial performance of a company during a...
 17 18 12 13 15 16 5 14 2 3 4 6 7 10 11 1 He 1 H 2 N O F Ne Li Be Na Mg $3 Si CI Ar Al Cr Mn Fe Co Ca Sc Ni Cu Zn 4 K Ti V Ga Ge As Se Br Kr Sr Y Zr Nb Mo Tc Ru Rh Pd Ag Cd In Sn Sb Te 5 Rb Xe 6 Cs Ba La WRe Os Ir Au Hg TI...
 TABLE B.2 Future Value of 1 Rate 2% 3% 5% 6% 7% 8% 0% 12% 15% 1.0000 0000 1.1000 1200 1.2100 12544 1.0303 1.0612 1.0927 1249 1.1576 1.1910 1.2250 1.2597 1290 13310 1.4049 1.5735 1.6105 1.7623 1.0000 1.0000 1.0000 1.0000 1.0000 1.0000 1.0000 1.0000 1.0000 1.0100 .0200 1.0300 1.0400 0500 1.0201 .0404 1.0609 1.0816 1.1025 11236 .1449 .1664 1.1881 1.0700 1.0800 1.0900 1.0406 .0824 1.1255 11699 1.2155 1.2625 .3108 3605 1.4116 1.0510 1.1041 .1593 1.2167 1.2763 1.3382 .4026 1.4693 5386...
Most questions answered within 3 hours.
-
The extent to which assets are financed by borrowed funds and
other liabilities is indicated by:...
asked 36 seconds ago -
Explain in detail
Germany is the fifth largest economy
explain what goods and services Germany specializes...
asked 15 minutes ago -
The density of platinum is 21.45 g/mL. If a cube of platinum
with a mass of...
asked 20 minutes ago -
Accounts Receivable
Sales
A/R Posting
Extended Sales Invoice
Packing Slip
Compare invoice to packing slip 2...
asked 23 minutes ago -
Michaella, age 23, is a full-time law student and is claimed by
her parents as a...
asked 24 minutes ago -
Why are polymers not typically casted into products?
asked 41 minutes ago -
When rolling a die 129 times, what is the probability of rolling
a 6 no more...
asked 57 minutes ago -
4. A call option currently sells for $7.75. It has a strike
price of $85 and...
asked 46 minutes ago -
1.
You need to prepare 10.0 liters of an acid aqueous solution with a
pH of...
asked 49 minutes ago -
Along an aggregate supply curve, if the level of output is less
than the natural level...
asked 50 minutes ago -
By 2025, annual consumption in emerging markets will total $30
trillion and contribute more than ________...
asked 55 minutes ago -
At what point does reformation cease to be a viable option for
those who are oppressed...
asked 59 minutes ago