
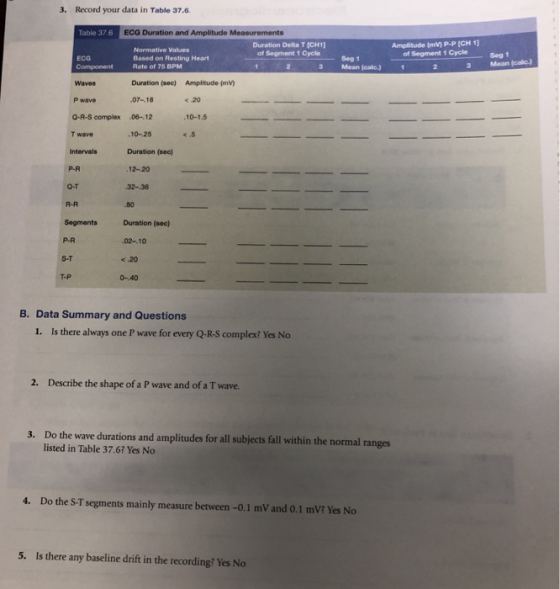
3. Record your data in Table 37.6 Table 37.6 ECG Duration and Amplitude Duration Delta T ICH1) of Segment 1 Cycle Amplitude (mV) P-P [CH 1] of Segment 1 Cycle Normative Values Seg 1 3 Mean (calo) ECG Based on Resting Heart Seg 1 3 Mean (cale.) Rate of 75 BPM Duration (sec) Amplitude (mV 4 20 10-1.5 Waves P wave 07-.18 Q-R-S complex .06-.12 T wave 10-,25 Intervals P-R Q-T Duration (sea) 12-20 32-36 .80 Duration (sec) 02-.10 R-R Segments P-R S-T T-P
Homework Answers
1. Under these conditions, there is NO PR interval (since the P wave didn't cause theQRS complex). The atria and the ventricles are functioning entirely independently of each other. However, both P waves and QRS complexes are still identifiable on the ECG.
2. P Wave:
The P wave represents depolarization of the right and left atria.
Onset of the P Wave is identified as: the first abrupt or gradual deviation from the baseline. The point where the wave returns to the baseline marks the end of the P Wave. A QRS complex normally follows each P Wave. A normal sinus P Wave indicates that the electrical impulse responsible for the P Wave originated in the SA node and that normal depolarization of the right and left atria has occurred
A T Wave represents ventricular repolarization.
Repolarization of the ventricles begins at the epicardial surface of the ventricles and progresses inwardly through the ventricular walls to the endocardial surface. The T Wave occurs during the last part of the ventricular systole. The onset of the T Wave is the first or abrupt or gradual deviation from the S-T segment; or from the point where the slope of the S-T segment appears to become abruptly of gradually steeper. If the S-T segment is absent, the T Wave begins at the end of the QRS Complete (or the J Point). The point where the T Wave returns to the baseline marks the end of the T Wave. Often the onset and end of the T Wave are difficult to determine with certainty.
- The DURATION of the T Wave is 0.10 to 0.25 seconds or greater.
- The AMPLITUDE of the T Wave is less than 5 mm.
- The SHAPE of the T Wave is sharply or bluntly rounded and slightly asymmetrical.
- A T Wave always follows a QRS Complex.
P WAVE

T WAVE

4. CHANGES IN THE ELECTROCARDIOGRAM (ECG) during exercise in normal subjects were described by Simonson in 1953.' He observed decreased R wave amplitude and right axis deviation as well as junctional depression of the ST segment and decreased T wave amplitude. Sjostrand2 showed that the depression of the QRS-ST junction during exercise in normal subjects is related to heart rate. Later, Irisawa3 demonstrated a marked increase of the P wave amplitude during exercise. These findings have been confirmed in recent years by quantitative ECG analysis with modern computer techniques. 4-12 Blomqvist4 " and Bruce et al.5' 6 demonstrated that such ECG changes occur gradually when a multistage exercise test is performed. In the recovery period, these changes reverse, although the relation between ST-segment amplitude and heart rate in the recovery period seems to follow a different pattern than during exercise.' `
.
Add Answer to:
A. Data and Calculations Subject Profile Name Gender Age Height- Weight 1. Record your data in Ta...
3 6 = Cardiovasc... Saved to my Mac Qu Layout References Mailings Review View - 14...
 3 6 = Cardiovasc... Saved to my Mac Qu Layout References Mailings Review View - 14 • A4 A A • A đốc A = "/E • XE = = obe X, X A AA © AA Name A: SUPINE, RESTING, REGULAR BREATHING DATA LE ahhhhhh each larger square is 0.2 sec Table 1 Cardiac Cycle Measurement AT (seconds) (R-R Interval) BPM (Beats Per Minute) Cycle 1 Cycle 2 Cycle 3 Mean Table 2 Ventricular Readings Q-T Interval (seconds) corresponds...
Fill out the heart rate table in the sitting tab Lab Notebook Standing Sitting After Exercise...
 Fill out the heart rate table in the sitting tab
Lab Notebook Standing Sitting After Exercise Cycle 2 ECG Component Cycle 1 Cycle 3 Mean Normal Duration Os 0.06-0.11 P wave P-R interval P-R segment Os 0.12-0.20 Os 0.08 Os <0.12 Os 0.36-0.44 QRS complex Q-T interval ST segment Os 0.12 Os 0.16 T wave Amplitude Omv <0.25 Stand P wave
Fill out the heart rate table in the sitting tab
Lab Notebook Standing Sitting After Exercise Cycle 2 ECG Component Cycle 1 Cycle 3 Mean Normal Duration Os 0.06-0.11 P wave P-R interval P-R segment Os 0.12-0.20 Os 0.08 Os <0.12 Os 0.36-0.44 QRS complex Q-T interval ST segment Os 0.12 Os 0.16 T wave Amplitude Omv <0.25 Stand P wave
A. Heart Sound Measurements Complete Table 17.1 with "Seated, at rest" and "After exercise" data and...
 A. Heart Sound Measurements Complete Table 17.1 with "Seated, at rest" and "After exercise" data and complete the required calculations. Table 17.1 After exercise Seated, at rest Selected area Measurement At Rest Inhalation Exhalation 97] 117] [106 110 R-wave to next ВРМ 1 R-wave 0.94] р.36 ] 0.56 0.98 R-wave to first Delta T 1 sound 0.41] 0.92 0.72] R-wave to 0.88 Delta T 1 second sound 0.05 0.1] 0.36 0.22] first to second Delta T 1 sound 0.82 1.48...
For each multiple choice question shade the letter of the alphabet of the appropriate answer on the scan sheet. Two...
 For each multiple choice question shade the letter of the alphabet of the appropriate answer on the scan sheet. Two marks will be given for a correct choice and zero mark will be given for an incorrect choice or no answer. 1. The force of cardiac contraction increases in response to a) an increased filling volume b) inhibition of cardiomyocyte L-Type (slow) Ca2 channels c activation of carotid baroreceptors d) activation of the myocardial muscarinic receptors e) Both a) and...
QUESTION 1. Which of the following is produced by the cells of the Zona Glomerulosa? Group...
QUESTION 1. Which of the following is produced by the cells of the Zona Glomerulosa? Group of answer choices Mineralocorticoids Glucocorticoids Glucagon T3 & T4 DHEA Question 2 During which phase of the cardiac cycle would you expect the pressure in the left ventricle to rise above the pressure in the aorta? Group of answer choices Isovolumetric filling Ventricular diastole Atrial systole Isovolumetric relaxation Isovolumetric contraction Question 3 Which hormone increases both Glycogenolysis and Gluconeogenesis? Group of answer choices DHEA...
 3 6 = Cardiovasc... Saved to my Mac Qu Layout References Mailings Review View - 14 • A4 A A • A đốc A = "/E • XE = = obe X, X A AA © AA Name A: SUPINE, RESTING, REGULAR BREATHING DATA LE ahhhhhh each larger square is 0.2 sec Table 1 Cardiac Cycle Measurement AT (seconds) (R-R Interval) BPM (Beats Per Minute) Cycle 1 Cycle 2 Cycle 3 Mean Table 2 Ventricular Readings Q-T Interval (seconds) corresponds...
 Fill out the heart rate table in the sitting tab
Lab Notebook Standing Sitting After Exercise Cycle 2 ECG Component Cycle 1 Cycle 3 Mean Normal Duration Os 0.06-0.11 P wave P-R interval P-R segment Os 0.12-0.20 Os 0.08 Os <0.12 Os 0.36-0.44 QRS complex Q-T interval ST segment Os 0.12 Os 0.16 T wave Amplitude Omv <0.25 Stand P wave
Fill out the heart rate table in the sitting tab
Lab Notebook Standing Sitting After Exercise Cycle 2 ECG Component Cycle 1 Cycle 3 Mean Normal Duration Os 0.06-0.11 P wave P-R interval P-R segment Os 0.12-0.20 Os 0.08 Os <0.12 Os 0.36-0.44 QRS complex Q-T interval ST segment Os 0.12 Os 0.16 T wave Amplitude Omv <0.25 Stand P wave
 A. Heart Sound Measurements Complete Table 17.1 with "Seated, at rest" and "After exercise" data and complete the required calculations. Table 17.1 After exercise Seated, at rest Selected area Measurement At Rest Inhalation Exhalation 97] 117] [106 110 R-wave to next ВРМ 1 R-wave 0.94] р.36 ] 0.56 0.98 R-wave to first Delta T 1 sound 0.41] 0.92 0.72] R-wave to 0.88 Delta T 1 second sound 0.05 0.1] 0.36 0.22] first to second Delta T 1 sound 0.82 1.48...
 For each multiple choice question shade the letter of the alphabet of the appropriate answer on the scan sheet. Two marks will be given for a correct choice and zero mark will be given for an incorrect choice or no answer. 1. The force of cardiac contraction increases in response to a) an increased filling volume b) inhibition of cardiomyocyte L-Type (slow) Ca2 channels c activation of carotid baroreceptors d) activation of the myocardial muscarinic receptors e) Both a) and...
Most questions answered within 3 hours.
-
For Dijkstra’s shortest path algorithm:
a. Give the Big-O time for Dijkstra’s shortest path algorithm
and...
asked 2 minutes ago -
Phosphorus violates the 'octet rule' in biological molecules,
forming more covalent bonds than expected based on...
asked 5 minutes ago -
A 1.3 eV electron has a 10-4 probability of tunneling
through a 2.4 eV potential barrier....
asked 23 minutes ago -
What is the one ingredient that is common to being successful
with all stakeholders?
profit
trust...
asked 22 minutes ago -
Write an assembly language 32 bit program that reads in lines of
text by a .txt...
asked 25 minutes ago -
what is the density ( in g/L) of hydrogen gas at 29 degrees C and a...
asked 34 minutes ago -
5-6. You are considering three investment alternatives for some
spare cash: Old Reliable Corporation stock (A1),...
asked 25 minutes ago -
Problem 16-02
Receivables Investment
Medwig Corporation has a DSO of 45 days. The company averages
$7,250...
asked 40 minutes ago -
Mr. Brown hired Lowe's Maintenance Services Limited to repair
and paint the exterior wall of his...
asked 41 minutes ago -
When might an index slow down the overall performance of the
database? Choose the best answer....
asked 46 minutes ago -
Due to a recession, expected inflation this year is only 2.25%.
However, the inflation rate in...
asked 47 minutes ago -
Write four functions: (IN PYTHON 3)
1) bound(l) - given a list of integers l, compute...
asked 50 minutes ago