
Homework Answers
 so stage at zero discharge is
22.7696 m
so stage at zero discharge is
22.7696 m
Add Answer to:
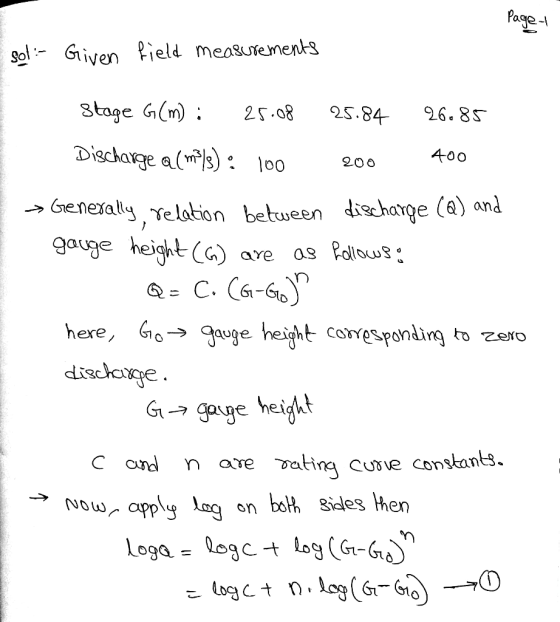
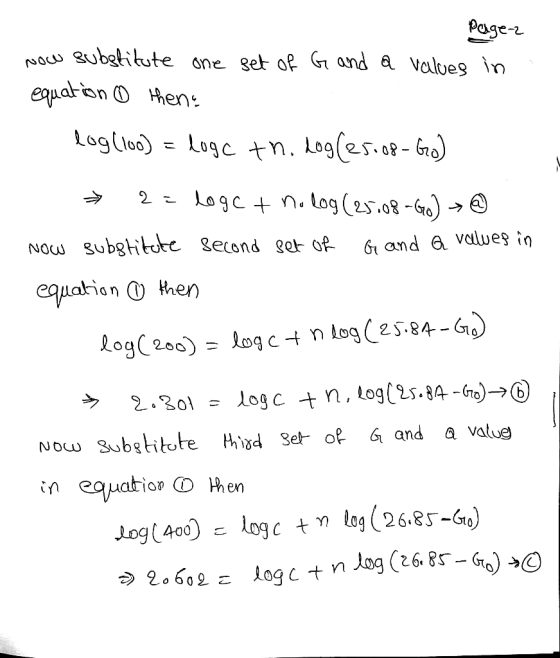
Q4. Stage-discharge data for a river was used to extract following information. Determine the sta...
Q1. The stage-discharge data of a river are given below. Establish a stage discharge relationship...
 Q1. The stage-discharge data of a river are given below. Establish a stage discharge relationship to predict the stage for known discharge. Assume the stage value for a zero discharge as 20.50 m. Also determine the stage of river corresponding to a discharge of 2600 m3/s. Table 1: Stage discharge data Stage (m): 21.95 22.45 22.8 2323.4 23.75 23.65 Q (m3/s)100 220 295 400 490 500 640 Stage (m) 24.05 24.55 24.85 25.4 25.15 25.55 25.9 m3 /s) 780 1010...
2 (a) The following data are annual maximum flood discharges for a river recorded over a...
 2 (a) The following data are annual maximum flood discharges for a river recorded over a 10 year period YearDischarge (m3s-1 2004 2005 2006 2007 2008 2009 2010 2011 2012 2013 80 76 58 112 96 59 179 75 129 42 The return period may be determined from the Gringorten Formula R- (n + 0.12) (m 0.44) (i)Using a logarithmic scale for return period and linear scale for discharge, plot these data and estimate the 80-year return period flood discharge...
Q4: The pump is used to deliver of water from a river to a storage reservoir....
 Q4: The pump is used to deliver of water from a river to a storage reservoir. The four pipes are connected in series of Inverse L shape which means the first pipe in vertical direction and others in horizontal direction. The first pipe in vertical position of 500m length of 150 mm diameter cast iron pipe, the second pipe is bend at 90' with a radius of 0.75m, the third pipe in horizontal direction of 100m length of 160mm diameter...
Table 1 below lists the annual peak discharge for the Ogeechee River, located on the coastal...
 Table 1 below lists the annual peak discharge for the Ogeechee River, located on the coastal plain of Georgia. Total number of observations are 25. (1) (2) Annual Peak Discharge (cfs) (4) Recurrence Interval (RI) (5) Chance/Probability of occurrence in any given year (%| (3 Rank (M) Year 1974 9,000 1975 16,200 1976 7,720 1977 11,500 1978 17,300 1979 18,000 1980 27,900 1981 6,600 8,320 1982 1983 10,000 1984 6,560 1985 8,600 1986 8,200 1987 16,500 1988 2,700 5,030 1989...
2) Compute the flood discharge through a uniform, straight river reach of 150 m for the...
 2) Compute the flood discharge through a uniform, straight river reach of 150 m for the following data: Manning's n for Channels (Chow, 1959). Type of Channel and Description Minimum Natural streams - minor streams (top width at floodstage < 100 ft) 1. Main Channels a clean, straight, full stage, no rifts or deep pools 0.025 1 b. same as above, but more stones and weeds 0.030 C. clean, winding, some pools and shoals 0.033 d. same as above, but...
Design an ogee spillway with the following data: (i) Height of spillway crest above river bed 100 m (ii) Design discharge 12,000 cumecs (iii) Number of spans 6 (iv) Clear distance between piers 1...
 Design an ogee spillway with the following data: (i) Height of spillway crest above river bed 100 m (ii) Design discharge 12,000 cumecs (iii) Number of spans 6 (iv) Clear distance between piers 15 m (v) Thickness of pier 3 m Slope of d/s face of the overflow section 0.8:1 Assume any other data if required.
Design an ogee spillway with the following data: (i) Height of spillway crest above river bed 100 m (ii) Design discharge 12,000 cumecs (iii)...
Design an ogee spillway with the following data: (i) Height of spillway crest above river bed 100 m (ii) Design discharge 12,000 cumecs (iii) Number of spans 6 (iv) Clear distance between piers 15 m (v) Thickness of pier 3 m Slope of d/s face of the overflow section 0.8:1 Assume any other data if required.
Design an ogee spillway with the following data: (i) Height of spillway crest above river bed 100 m (ii) Design discharge 12,000 cumecs (iii)...
Answer #1,3,4,5 thanks. The data in table 1 are of peak 1. Make the following rver...
 Answer #1,3,4,5 thanks.
The data in table 1 are of peak 1. Make the following rver stage (gage height) and river discharge from 1916-1931 for Cumberland height) an River at Cumberland Falls, Kentucky separate graphs: 1. a scatterplot of the Water Year vs Gage Height, and 2. a Discharge. Note. Water Year should be placed on the x-axes. two scatterplot of Water Year vs River 3. 4. nd the mean, median, mode, and standard deviation for the gage heights and...
Answer #1,3,4,5 thanks.
The data in table 1 are of peak 1. Make the following rver stage (gage height) and river discharge from 1916-1931 for Cumberland height) an River at Cumberland Falls, Kentucky separate graphs: 1. a scatterplot of the Water Year vs Gage Height, and 2. a Discharge. Note. Water Year should be placed on the x-axes. two scatterplot of Water Year vs River 3. 4. nd the mean, median, mode, and standard deviation for the gage heights and...
The following information pertains to Brilliant CC: EXTRACT FROM THE STATEMENT OF FINANCIAL POSITION AS AT...
 The following information pertains to Brilliant CC: EXTRACT FROM THE STATEMENT OF FINANCIAL POSITION AS AT 28 FEBRUARY 2020 2019 ASSETS R R Non-current assets 54 000 50 000 Property, plant and equipment 54 000 50 000 Current assets 38 400 36 000 Inventories 12 400 10 200 Trade receivables (Trade debtors) 10 000 10 400 Other financial assets 12 000 14 000 Cash and cash equivalents. 4 000 1 400 Total assets..... 92 400 86 000 EQUITY AND LIABILITIES...
Table 2.1: Estimated average power used per person as a function of the stage of human...
 Table 2.1: Estimated average power used per person as a function of the stage of human development (worldwide) or as a function of year (for the United States, 1850-2000). The power values are calculated from the primary energy use. society power consumption (W) hunter 100 use of fire 200 domestication of animals 500 Renaissance 1160 1850 4880 1900 5340 1950 7300 1960 8180 1970 11,000 1980 1990 11,000 2000 11,730 Based on data from G.J. Aubrecht II, Energy: Physical, Environmental...
What is the fourth stage in the following sequence of events: data, information, knowledge, and sequence...
 What is the fourth stage in the following sequence of events: data, information, knowledge, and sequence of a. Behavior change b. Wisdom c. Attitude d. Intelligence 4. Which of the following types of interoperability refers to how the data should be formatted and structured so that seamless exchange can take place? a. Technical b. Syntactic c. Semantic d. Process 5. What federal agency is responsible for the coordination and implementation of EHR technology for the exchange of ePHI? a. ONC...
 Q1. The stage-discharge data of a river are given below. Establish a stage discharge relationship to predict the stage for known discharge. Assume the stage value for a zero discharge as 20.50 m. Also determine the stage of river corresponding to a discharge of 2600 m3/s. Table 1: Stage discharge data Stage (m): 21.95 22.45 22.8 2323.4 23.75 23.65 Q (m3/s)100 220 295 400 490 500 640 Stage (m) 24.05 24.55 24.85 25.4 25.15 25.55 25.9 m3 /s) 780 1010...
 2 (a) The following data are annual maximum flood discharges for a river recorded over a 10 year period YearDischarge (m3s-1 2004 2005 2006 2007 2008 2009 2010 2011 2012 2013 80 76 58 112 96 59 179 75 129 42 The return period may be determined from the Gringorten Formula R- (n + 0.12) (m 0.44) (i)Using a logarithmic scale for return period and linear scale for discharge, plot these data and estimate the 80-year return period flood discharge...
 Q4: The pump is used to deliver of water from a river to a storage reservoir. The four pipes are connected in series of Inverse L shape which means the first pipe in vertical direction and others in horizontal direction. The first pipe in vertical position of 500m length of 150 mm diameter cast iron pipe, the second pipe is bend at 90' with a radius of 0.75m, the third pipe in horizontal direction of 100m length of 160mm diameter...
 Table 1 below lists the annual peak discharge for the Ogeechee River, located on the coastal plain of Georgia. Total number of observations are 25. (1) (2) Annual Peak Discharge (cfs) (4) Recurrence Interval (RI) (5) Chance/Probability of occurrence in any given year (%| (3 Rank (M) Year 1974 9,000 1975 16,200 1976 7,720 1977 11,500 1978 17,300 1979 18,000 1980 27,900 1981 6,600 8,320 1982 1983 10,000 1984 6,560 1985 8,600 1986 8,200 1987 16,500 1988 2,700 5,030 1989...
 2) Compute the flood discharge through a uniform, straight river reach of 150 m for the following data: Manning's n for Channels (Chow, 1959). Type of Channel and Description Minimum Natural streams - minor streams (top width at floodstage < 100 ft) 1. Main Channels a clean, straight, full stage, no rifts or deep pools 0.025 1 b. same as above, but more stones and weeds 0.030 C. clean, winding, some pools and shoals 0.033 d. same as above, but...
 Design an ogee spillway with the following data: (i) Height of spillway crest above river bed 100 m (ii) Design discharge 12,000 cumecs (iii) Number of spans 6 (iv) Clear distance between piers 15 m (v) Thickness of pier 3 m Slope of d/s face of the overflow section 0.8:1 Assume any other data if required.
Design an ogee spillway with the following data: (i) Height of spillway crest above river bed 100 m (ii) Design discharge 12,000 cumecs (iii)...
Design an ogee spillway with the following data: (i) Height of spillway crest above river bed 100 m (ii) Design discharge 12,000 cumecs (iii) Number of spans 6 (iv) Clear distance between piers 15 m (v) Thickness of pier 3 m Slope of d/s face of the overflow section 0.8:1 Assume any other data if required.
Design an ogee spillway with the following data: (i) Height of spillway crest above river bed 100 m (ii) Design discharge 12,000 cumecs (iii)...
 Answer #1,3,4,5 thanks.
The data in table 1 are of peak 1. Make the following rver stage (gage height) and river discharge from 1916-1931 for Cumberland height) an River at Cumberland Falls, Kentucky separate graphs: 1. a scatterplot of the Water Year vs Gage Height, and 2. a Discharge. Note. Water Year should be placed on the x-axes. two scatterplot of Water Year vs River 3. 4. nd the mean, median, mode, and standard deviation for the gage heights and...
Answer #1,3,4,5 thanks.
The data in table 1 are of peak 1. Make the following rver stage (gage height) and river discharge from 1916-1931 for Cumberland height) an River at Cumberland Falls, Kentucky separate graphs: 1. a scatterplot of the Water Year vs Gage Height, and 2. a Discharge. Note. Water Year should be placed on the x-axes. two scatterplot of Water Year vs River 3. 4. nd the mean, median, mode, and standard deviation for the gage heights and...
 The following information pertains to Brilliant CC: EXTRACT FROM THE STATEMENT OF FINANCIAL POSITION AS AT 28 FEBRUARY 2020 2019 ASSETS R R Non-current assets 54 000 50 000 Property, plant and equipment 54 000 50 000 Current assets 38 400 36 000 Inventories 12 400 10 200 Trade receivables (Trade debtors) 10 000 10 400 Other financial assets 12 000 14 000 Cash and cash equivalents. 4 000 1 400 Total assets..... 92 400 86 000 EQUITY AND LIABILITIES...
 Table 2.1: Estimated average power used per person as a function of the stage of human development (worldwide) or as a function of year (for the United States, 1850-2000). The power values are calculated from the primary energy use. society power consumption (W) hunter 100 use of fire 200 domestication of animals 500 Renaissance 1160 1850 4880 1900 5340 1950 7300 1960 8180 1970 11,000 1980 1990 11,000 2000 11,730 Based on data from G.J. Aubrecht II, Energy: Physical, Environmental...
 What is the fourth stage in the following sequence of events: data, information, knowledge, and sequence of a. Behavior change b. Wisdom c. Attitude d. Intelligence 4. Which of the following types of interoperability refers to how the data should be formatted and structured so that seamless exchange can take place? a. Technical b. Syntactic c. Semantic d. Process 5. What federal agency is responsible for the coordination and implementation of EHR technology for the exchange of ePHI? a. ONC...
Most questions answered within 3 hours.
-
A business executive has the option to invest money in two
plans: Plan A guarantees that...
asked 33 minutes ago -
Hello, can someone please help me answer this question?
How much heat is absorbed by a...
asked 31 minutes ago -
. A marketing researcher conducted a survey of 25 shoppers
randomly selected at the local mall...
asked 48 minutes ago -
Create an comprehensive response to the
following:
Antimicrobial agents work on a multitude of microbes (bacteria,...
asked 50 minutes ago -
6.13 LAB: Step counter. Section 6.3.
A pedometer treats walking 2,000 steps as walking 1 mile....
asked 45 minutes ago -
(14.2) A block of mass m = 10 kg riding on a frictionless
horizontal plane is...
asked 48 minutes ago -
Use any search engine to search for articles about Starbucks
partnership with Tata Companies in India...
asked 47 minutes ago -
Let’s say that for some reason Bank Excess Reserves suddenly
increase sharply. What effect would this...
asked 56 minutes ago -
Given:
Curent Assets: $600,000
Total Assets: $2,600,000
Current Liabilities: $500,000
Total Liabilities: $1,700,000
What is the...
asked 1 hour ago -
1. What is a “Bankster”? What is insider trading? Why is it
illegal?
2. What is...
asked 59 minutes ago -
A transverse wave on a cord is given by
D(x,t)=0.18sin(2.7x−61.0t), where Dand x are in m...
asked 1 hour ago -
ASSIGNMENT
ANSWER ANY TWO OF THE FOLLOWING IN 2-3 PARAGRAPHS OF EACH
QUESTION.
1: Where is...
asked 1 hour ago