
Homework Answers


Add Answer to:
Do not use MS Excel or statistics software unless stated otherwise (1 -2) (Confidence Interval) T...
Do not use MS Excel or statistics software unless stated otherwise (1 -2) (Confidence Interval) T...
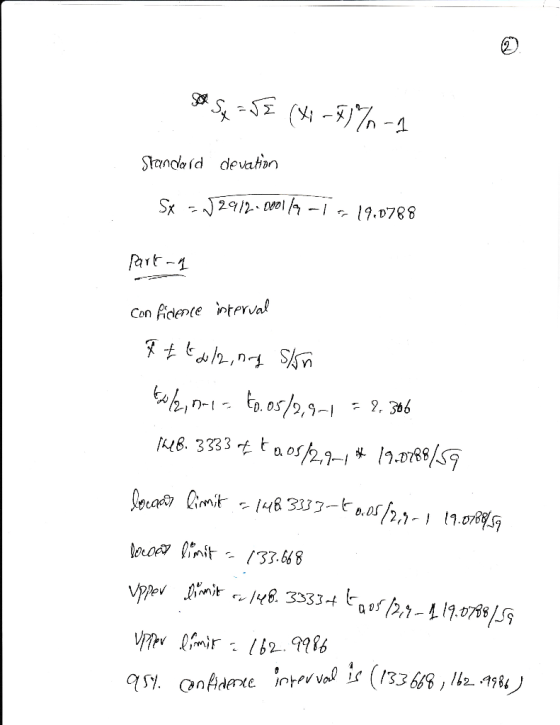
 Do not use MS Excel or statistics software unless stated otherwise (1 -2) (Confidence Interval) The following sample data are measurements of weight of middle school students. 153,148, 151, 163, 114,164, 135, 131,176 (25%) Assume that we do not know the true standard deviation of middle school students Calculate the two-sided 95% confidence intervals on the mean (find both upper and lower limits). I. 2. (25%) Assume now that we know the standard deviation of all middle school students is...
Rounding Instructions: Round to 2 decimal places unless otherwise stated. Question 1 Suppose a random sample...
 Rounding Instructions: Round to 2 decimal places unless otherwise stated. Question 1 Suppose a random sample of 900 UT male students was taken to estimate the average height of all 20,000 U1 male students. The sample average assume we don't know the SD of the population) 70" and sample SD 3.3. (For all parts of this problem a. Estimate the average height of all male Ul males EVavo 70 f. Now suppose we have n 25 and we know the...
Use the given degree of confidence and sample data to find a confidence interval for the...
 Use the given degree of confidence and sample data to find a confidence interval for the population standard deviation o. Assume that the population has a normal distribution. Round the confidence interval limits to the same number of decimal places as the sample standard deviation. College students' annual earnings: 98% confidence; n = 9, sample mean is $4121, s = $873 $551<o< $1925 O $590 < 0 < $1672 $531 < o < $1708 $687 <o< $1139
Use the given degree of confidence and sample data to find a confidence interval for the...
Use the given degree of confidence and sample data to find a confidence interval for the population standard deviation σ. Assume that the population has a normal distribution. Round the confidence interval limits to the same number of decimal places as the sample standard deviation. College students' annual earnings: 98% confidence; n = 9, sample mean is $4121, s = $873 Group of answer choices: a) $551 < σ < $1925 b) $590 < σ < $1672 c) $531 <...
1. A C level confidence interval is described as what? (3 points) Oan interval computed from...
 1. A C level confidence interval is described as what? (3 points) Oan interval computed from a data sample by a method that has the probability C of producing an interval containing the true value of the parameter any interval within the margin of error O an interval with a margin of error C that is also correct C% of the time Oany interval that follows the 68-95-99.7 rules Oan interval computed from a data sample that guarantees that the...
Q3: Practice building Confidence Intervals For each scenario, take the sample data and build up the specified confidence interval for the specified population parameter. a. Scenario: You want t...
 Q3: Practice building Confidence Intervals For each scenario, take the sample data and build up the specified confidence interval for the specified population parameter. a. Scenario: You want to know the average number of calories you consume per day. Over the next 5 months you randomly select 25 days and carefully record your consumption on those days (assume that you don't change your eating habits) Build an 80% confidence interval for your average daily consumption of calories if the following...
Use the standard normal distribution or the t-distribution to construct the indicated confidence interval for the...
Use the standard normal distribution or the t-distribution to construct the indicated confidence interval for the population mean of each data set. Justify your decision. If neither distribution can be used, explain why. Interpret the results. (a) In a random sample of 36 patients, the mean waiting time at a dentist’s office was 24 minutes and the standard deviation was 7.5 minutes. Construct a 90% confidence interval for the population mean. (b) In a random sample of 25 cereal boxes,...
2) (3 points) A news report states that the 90% confidence interval for the mean number...
 2) (3 points) A news report states that the 90% confidence
interval for the mean number of daily calories consumed by
participants in a medical study is (2020, 2160). Assume the
population distribution for daily calories consumed is normally
distributed and that the confidence interval was based on a simple
random sample of 20 observations. Calculate the sample mean, the
margin of error, and the sample standard deviation based on the
stated confidence interval and the given sample size. Use...
2) (3 points) A news report states that the 90% confidence
interval for the mean number of daily calories consumed by
participants in a medical study is (2020, 2160). Assume the
population distribution for daily calories consumed is normally
distributed and that the confidence interval was based on a simple
random sample of 20 observations. Calculate the sample mean, the
margin of error, and the sample standard deviation based on the
stated confidence interval and the given sample size. Use...
Confidence Interval
An article in the Journal of Agricultural Science [“The Use of Residual Maximum Likelihood to Model Grain Quality Characteristics of Wheat with Variety, Climatic andNitrogen Fertilizer Effects” (1997, Vol. 128, pp. 135–142)] investigated means of wheat grain crude protein content (CP) and Hagberg falling number (HFN) surveyed inthe UK. The analysis used a variety of nitrogen fertilizer applications (kg N/ha), temperature (ºC), and total monthly rainfall (mm). The data shown below describetemperatures for wheat grown at Harper Adams Agricultural College...
Question 2) Construct a 95% 2-sided confidence interval on the mean weight of the skittles. 48...
 Question 2) Construct a 95% 2-sided
confidence interval on the mean weight of the skittles.
48 students participated in evaluating small package of skittles. The following table shows the result of this study. Assume the weight of skittles are normally distributed with standard deviation of 2 grams. Net Weight Green Red Yellow Brown Orange Count 2923 Total 2978.4 576 589 641 531 586 Sample Mean 62.05
Question 2) Construct a 95% 2-sided
confidence interval on the mean weight of the skittles.
48 students participated in evaluating small package of skittles. The following table shows the result of this study. Assume the weight of skittles are normally distributed with standard deviation of 2 grams. Net Weight Green Red Yellow Brown Orange Count 2923 Total 2978.4 576 589 641 531 586 Sample Mean 62.05
 Do not use MS Excel or statistics software unless stated otherwise (1 -2) (Confidence Interval) The following sample data are measurements of weight of middle school students. 153,148, 151, 163, 114,164, 135, 131,176 (25%) Assume that we do not know the true standard deviation of middle school students Calculate the two-sided 95% confidence intervals on the mean (find both upper and lower limits). I. 2. (25%) Assume now that we know the standard deviation of all middle school students is...
 Rounding Instructions: Round to 2 decimal places unless otherwise stated. Question 1 Suppose a random sample of 900 UT male students was taken to estimate the average height of all 20,000 U1 male students. The sample average assume we don't know the SD of the population) 70" and sample SD 3.3. (For all parts of this problem a. Estimate the average height of all male Ul males EVavo 70 f. Now suppose we have n 25 and we know the...
 Use the given degree of confidence and sample data to find a confidence interval for the population standard deviation o. Assume that the population has a normal distribution. Round the confidence interval limits to the same number of decimal places as the sample standard deviation. College students' annual earnings: 98% confidence; n = 9, sample mean is $4121, s = $873 $551<o< $1925 O $590 < 0 < $1672 $531 < o < $1708 $687 <o< $1139
 1. A C level confidence interval is described as what? (3 points) Oan interval computed from a data sample by a method that has the probability C of producing an interval containing the true value of the parameter any interval within the margin of error O an interval with a margin of error C that is also correct C% of the time Oany interval that follows the 68-95-99.7 rules Oan interval computed from a data sample that guarantees that the...
 Q3: Practice building Confidence Intervals For each scenario, take the sample data and build up the specified confidence interval for the specified population parameter. a. Scenario: You want to know the average number of calories you consume per day. Over the next 5 months you randomly select 25 days and carefully record your consumption on those days (assume that you don't change your eating habits) Build an 80% confidence interval for your average daily consumption of calories if the following...
 2) (3 points) A news report states that the 90% confidence
interval for the mean number of daily calories consumed by
participants in a medical study is (2020, 2160). Assume the
population distribution for daily calories consumed is normally
distributed and that the confidence interval was based on a simple
random sample of 20 observations. Calculate the sample mean, the
margin of error, and the sample standard deviation based on the
stated confidence interval and the given sample size. Use...
2) (3 points) A news report states that the 90% confidence
interval for the mean number of daily calories consumed by
participants in a medical study is (2020, 2160). Assume the
population distribution for daily calories consumed is normally
distributed and that the confidence interval was based on a simple
random sample of 20 observations. Calculate the sample mean, the
margin of error, and the sample standard deviation based on the
stated confidence interval and the given sample size. Use...
 Question 2) Construct a 95% 2-sided
confidence interval on the mean weight of the skittles.
48 students participated in evaluating small package of skittles. The following table shows the result of this study. Assume the weight of skittles are normally distributed with standard deviation of 2 grams. Net Weight Green Red Yellow Brown Orange Count 2923 Total 2978.4 576 589 641 531 586 Sample Mean 62.05
Question 2) Construct a 95% 2-sided
confidence interval on the mean weight of the skittles.
48 students participated in evaluating small package of skittles. The following table shows the result of this study. Assume the weight of skittles are normally distributed with standard deviation of 2 grams. Net Weight Green Red Yellow Brown Orange Count 2923 Total 2978.4 576 589 641 531 586 Sample Mean 62.05
Most questions answered within 3 hours.
-
The price of 1 lb of potatoes is $1.75. If all the potatoes sold
today at...
asked 42 minutes ago -
Garcia Company issues 20.00%, 15-year bonds with a par value of
$470,000 and semiannual interest payments....
asked 40 minutes ago -
In C++ Programming, Try using loops only.
This lab demonstrates the use of the While Loop...
asked 1 hour ago -
Effect of DCMU and sodium azide on Chlamydomonas? We did an
experiment where we had Chlamydomonas...
asked 2 hours ago -
1a) According to the ideal gas law, _______________.
a. a gas has infinite volume at absolute...
asked 3 hours ago -
Oakdale Fashions, Inc. had $245,000 in 2018 taxable income.
Using the tax schedule in Table 2.3...
asked 4 hours ago -
The marketing class at CSUS had an average score of 150. An
educational analyst determined that...
asked 5 hours ago -
Justin Case has purchased a $250 000 home by putting 20 % down
and taking out...
asked 5 hours ago -
1. In a labor market, marginal cost for a firm is
____________.
a. recruiting cost
b....
asked 6 hours ago -
On January 1, 2019, ABC Company issued $60,000,000 of 20-year,
10.5% bonds when the market rate...
asked 6 hours ago -
39.4% of US homes continue to use a landline in addition to cell
phone service. 3...
asked 7 hours ago -
Starting with benzene, synthesize 1-phenyl-1-butyne.
Show intermediates and reagents.
asked 8 hours ago