IS/LM: Use the same setup as #1, but now Investment spending is a function of the real interest r...
IS/LM: Use the same setup as #1, but now Investment spending is a function of the real interest rate: I = 10000 – 50000r. Government purchase are now $1200b (makes for nicer numbers).
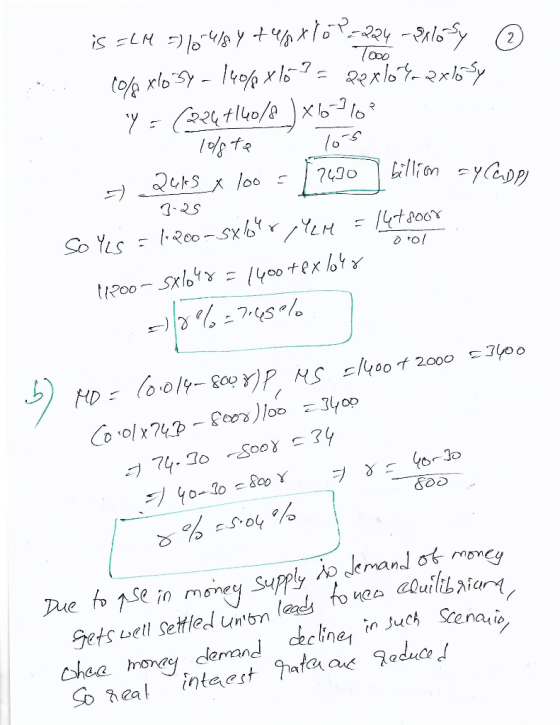
Money demand in the economy is MD= (0.01Y – 800r)P + o. Assume the current money supply is $1400b, the price level/CPI is 100, and there are no money demand shocks to worry about (o = 0).
a) Derive the IS curve and the LM curve for this economy, and calculate the level of GDP and the real interest rate.
b) Suppose the Fed increases the money supply to $2000b. For now, assume that the level of GDP stays the same. Use the money demand equation and the current level of GDP to find the new interest rate in the economy. Briefly describe why the Fed’s increase of the money supply changes the interest rate.
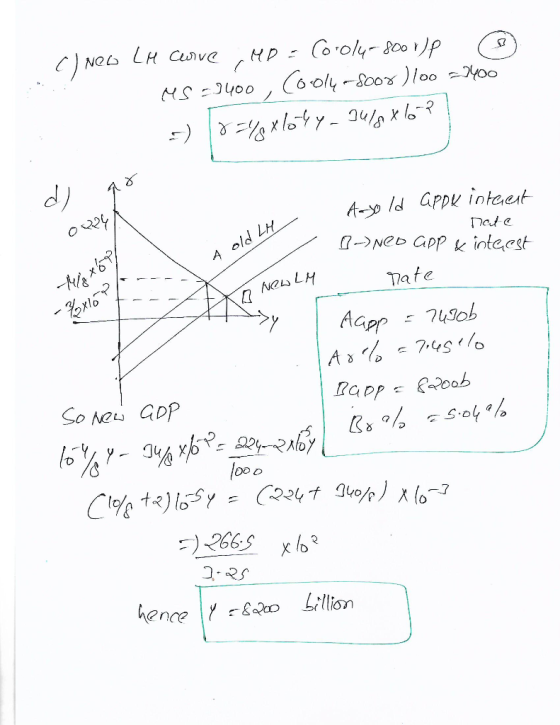
c) Derive the new LM curve based on the higher money supply. Adopting our usual “different interest rate at the same level of GDP” thinking, how would you describe this change in the LM curve graphically? 4b and 4c are the “initial shock” part of our 3-part IS-LM story.
d) Based on the new LM curve, calculate the new level of GDP and interest rate in the economy, and draw an IS-LM graph that shows the before and after. Label both intersections, but no need to label intercepts or worry about scale too much.
e) Use our 3-part story to explain why the interest rate change you found in 4c is different from the change in 4b. Discuss the 3-part story, including the arrows in your graph, and you should see the answer.
Homework Answers

Add Answer to:
IS/LM: Use the same setup as #1, but now Investment spending is a function of the real interest r...
Please box answers! Thank you. 11. Monetary policy and the LM curve Aa Aa The following graph shows the demand and supply of real money balances in a hypothetical economy. Use the black point (X point...
 Please box answers! Thank
you.
11. Monetary policy and the LM curve Aa Aa The following graph shows the demand and supply of real money balances in a hypothetical economy. Use the black point (X point) to indicate the equilibrium in this market. Dashed drop lines will automatically extend to both axes. REAL INTEREST RATE [Percent) 10 Equilibrium Supply New Supply New Equilibrium Demand 3 0 10 20 30 40 50 60 70 80 90 100 REAL MONEY BALANCES Help...
Please box answers! Thank
you.
11. Monetary policy and the LM curve Aa Aa The following graph shows the demand and supply of real money balances in a hypothetical economy. Use the black point (X point) to indicate the equilibrium in this market. Dashed drop lines will automatically extend to both axes. REAL INTEREST RATE [Percent) 10 Equilibrium Supply New Supply New Equilibrium Demand 3 0 10 20 30 40 50 60 70 80 90 100 REAL MONEY BALANCES Help...
Real interest rate, r (%) Derive the LM curve graphically given the money market diagram below...
 Real interest rate, r (%) Derive the LM curve graphically given the money market diagram below Real interest rate, r (%) MS 14 14 12 MD(Y $16,000) MD(Y $12,000) 50 110MD(Y $8,000 0 40 80 120 160 200 240 Real money supply and real money demanc 1.) Use the point drawing tool to plot three points, one for each level of real GDP Properly label each point. 0 2 4 6 8 10 12 14 16 18 20 Real GDP,...
Consider the following economy with: Real Money demand 〖 (M/P)〗^d = – 12 R + 0.38 Y Real Money supply (M^s/P)= 4510 De...
Consider the following economy with: Real Money demand 〖 (M/P)〗^d = – 12 R + 0.38 Y Real Money supply (M^s/P)= 4510 Derive the LM curve Derive the LM curve when the money supply increases by 680. Derive the LM curve when money supply decreases by 12% Compare the LM curves from a, b and c by graphing them using any graphing tool (excel preferably). Comment on the differences. Find the value of money demanded when income Y = 15,000...
B2. Closed Economy IS-LM-FE model: The behaviour of households and firms in a closed economy is...
 B2. Closed Economy IS-LM-FE model: The behaviour of households and firms in a closed economy is represented by the following equations Desired consumptionC 200+0.8(Y-T-500r Desired investment : r = 200-500r Real money demand where expected inflation is ㎡-0.10 and taxes depend on income according to T 20+0.25Y. (a) Derive an expression for the IS curve with the real interest rate on the left side of the equation. How does the position of the IS curve depend on G? (b) If...
1. In an economy which has a national income identity as the following; Y= C+ I + G + NX where C ...
 I need help with this.
1. In an economy which has a national income identity as the following; Y= C+ I + G + NX where C = 400 + 0.6 Yd,; 1 = 1000-4600 r, G-1240 T-200 +0.25 Y; NX-400-0.05Y-8 00 e ( ofcourse, Yd=Y-T) Where e- foreign currency/ domestic currency, and initially set at e 1.25+2.5R The money demand function is Md- 0.75 Y-7500 r, and money supply is set by the Central Bank at 450. All calculation...
I need help with this.
1. In an economy which has a national income identity as the following; Y= C+ I + G + NX where C = 400 + 0.6 Yd,; 1 = 1000-4600 r, G-1240 T-200 +0.25 Y; NX-400-0.05Y-8 00 e ( ofcourse, Yd=Y-T) Where e- foreign currency/ domestic currency, and initially set at e 1.25+2.5R The money demand function is Md- 0.75 Y-7500 r, and money supply is set by the Central Bank at 450. All calculation...
IS LM type question
The following equations describe the economy.• C = 100+ 0.8 Y• I = 200- 1000 i• L = Y – 10000 iInitially, government expenditure is $550, and taxes are $500. The real money supply equals$900.a. Derive the formulas for the IS curve and LM curve. (4pts)b. What are the initial levels of GDP, the interest rate, consumption, and investment?Owing to a drop in investor confidence, the autonomous component of investment dropsby 90. (2pts)c. By how much do income, the interest...
2. The demand for money is: Mº = PYL (1), where P is the price level,...
 2. The demand for money is: Mº = PYL (1), where P is the price level, Y is the real GDP and L () is an inverse function of the rate of interest (i.e. when i increases, L (1) decreases, and vice versa). Money supply is: M$ = mH, where H is the high-powered money issued by the central bank and m is the money multiplier. (a) Draw the money demand and supply curves on a graph with money demand...
Consider the economy of Hicksonia a. The consumption function is given by C = 200 +...
Consider the economy of Hicksonia a. The consumption function is given by C = 200 + 0.6(Y- T). The investment function is I = 200 - 40r. Government purchases and taxes are both 100. For this economy, graph the IS curve for r changing from 0 to 8. b. The money demand function in Hicksonia is (M/P)d = Y - 100r The money supply M is 1000 and the price level P is 2. For this economy, graph the LM...
Suppose that currently nominal interest rates, inflation, and expected inflation are all 2% right now. a)...
Suppose that currently nominal interest rates, inflation, and expected inflation are all 2% right now. a) Suppose the Federal Reserve increases interest rates in the economy. Draw a well labeled supply and demand diagram that shows how they typically would do that and how it affects the supply & demand in the money market and bond market. b) Suppose that when the Federal Reserve takes this action and expected inflation decreases from 2% to 1%. Show the effect of this...
6) Suppose that currently nominal interest rates, inflation, and expected inflation are all 2% right now....
6) Suppose that currently nominal interest rates, inflation, and expected inflation are all 2% right now. a) Suppose the Federal Reserve increases interest rates in the economy. Draw a well labeled supply and demand diagram that shows how they typically would do that and how it affects the supply & demand in the money market and bond market. b) Suppose that when the Federal Reserve takes this action and expected inflation decreases from 2% to 1%. Show the effect of...
 Please box answers! Thank
you.
11. Monetary policy and the LM curve Aa Aa The following graph shows the demand and supply of real money balances in a hypothetical economy. Use the black point (X point) to indicate the equilibrium in this market. Dashed drop lines will automatically extend to both axes. REAL INTEREST RATE [Percent) 10 Equilibrium Supply New Supply New Equilibrium Demand 3 0 10 20 30 40 50 60 70 80 90 100 REAL MONEY BALANCES Help...
Please box answers! Thank
you.
11. Monetary policy and the LM curve Aa Aa The following graph shows the demand and supply of real money balances in a hypothetical economy. Use the black point (X point) to indicate the equilibrium in this market. Dashed drop lines will automatically extend to both axes. REAL INTEREST RATE [Percent) 10 Equilibrium Supply New Supply New Equilibrium Demand 3 0 10 20 30 40 50 60 70 80 90 100 REAL MONEY BALANCES Help...
 Real interest rate, r (%) Derive the LM curve graphically given the money market diagram below Real interest rate, r (%) MS 14 14 12 MD(Y $16,000) MD(Y $12,000) 50 110MD(Y $8,000 0 40 80 120 160 200 240 Real money supply and real money demanc 1.) Use the point drawing tool to plot three points, one for each level of real GDP Properly label each point. 0 2 4 6 8 10 12 14 16 18 20 Real GDP,...
 B2. Closed Economy IS-LM-FE model: The behaviour of households and firms in a closed economy is represented by the following equations Desired consumptionC 200+0.8(Y-T-500r Desired investment : r = 200-500r Real money demand where expected inflation is ㎡-0.10 and taxes depend on income according to T 20+0.25Y. (a) Derive an expression for the IS curve with the real interest rate on the left side of the equation. How does the position of the IS curve depend on G? (b) If...
 I need help with this.
1. In an economy which has a national income identity as the following; Y= C+ I + G + NX where C = 400 + 0.6 Yd,; 1 = 1000-4600 r, G-1240 T-200 +0.25 Y; NX-400-0.05Y-8 00 e ( ofcourse, Yd=Y-T) Where e- foreign currency/ domestic currency, and initially set at e 1.25+2.5R The money demand function is Md- 0.75 Y-7500 r, and money supply is set by the Central Bank at 450. All calculation...
I need help with this.
1. In an economy which has a national income identity as the following; Y= C+ I + G + NX where C = 400 + 0.6 Yd,; 1 = 1000-4600 r, G-1240 T-200 +0.25 Y; NX-400-0.05Y-8 00 e ( ofcourse, Yd=Y-T) Where e- foreign currency/ domestic currency, and initially set at e 1.25+2.5R The money demand function is Md- 0.75 Y-7500 r, and money supply is set by the Central Bank at 450. All calculation...
 2. The demand for money is: Mº = PYL (1), where P is the price level, Y is the real GDP and L () is an inverse function of the rate of interest (i.e. when i increases, L (1) decreases, and vice versa). Money supply is: M$ = mH, where H is the high-powered money issued by the central bank and m is the money multiplier. (a) Draw the money demand and supply curves on a graph with money demand...
Most questions answered within 3 hours.
-
python
Define a function called print_values which takes a dictionary
object as a parameter. The function...
asked 48 minutes ago -
In Chapter 1 you created a program named Triangle in
which you displayed a seven-line triangle...
asked 43 minutes ago -
Research question: What are the differences between separately
stated and non separately stated transactions in an...
asked 1 hour ago -
By using Arduino write a code that connects two LEDs to two
push-buttons. Each button controls...
asked 2 hours ago -
Bank of America has bonds that pay a coupon interest rate of 5.5
percent and mature...
asked 2 hours ago -
Problem: Patient Fees C++
You are to write a program that computes a patient’s bill for...
asked 4 hours ago -
In a population of interest, we know that, 77% drink coffee, and
23% drink tea. Assume...
asked 4 hours ago -
Given that f(x) = e-(x-1) for x > 1, determine the following
probabilities:
a) P(X <...
asked 4 hours ago -
A mechanic pushes a 2.60 ✕ 103-kg car from rest to a speed of v,
doing...
asked 4 hours ago -
International information systems result in all of the following
except:
A. improved quality of information flow....
asked 4 hours ago -
The president of the retailer Prime Products has just approached
the company’s bank with a request...
asked 4 hours ago -
If the carrying amount is $200,000 and recoverable amount is
$205000, the impairment amount is:
Select...
asked 4 hours ago