Consider the following economy with: Real Money demand 〖 (M/P)〗^d = – 12 R + 0.38 Y Real Money supply (M^s/P)= 4510 De...
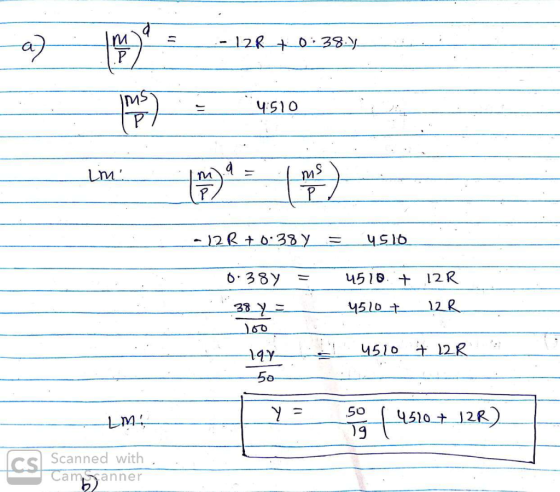
Consider the following economy with: Real Money demand 〖 (M/P)〗^d = – 12 R + 0.38 Y Real Money supply (M^s/P)= 4510 Derive the LM curve Derive the LM curve when the money supply increases by 680. Derive the LM curve when money supply decreases by 12% Compare the LM curves from a, b and c by graphing them using any graphing tool (excel preferably). Comment on the differences. Find the value of money demanded when income Y = 15,000 and interest rate R = 5. Is this equilibrium? Why? Why not? Consider the following economy with: Real Money demand 〖 (M/P)〗^d = – 12 R + 0.38 Y Real Money supply (M^s/P)= 4510 Derive the LM curve Derive the LM curve when the money supply increases by 680. Derive the LM curve when money supply decreases by 12% Compare the LM curves from a, b and c by graphing them using any graphing tool (excel preferably). Comment on the differences. Find the value of money demanded when income Y = 15,000 and interest rate R = 5. Is this equilibrium? Why? Why not?
Homework Answers


Add Answer to:
Consider the following economy with: Real Money demand 〖 (M/P)〗^d = – 12 R + 0.38 Y Real Money supply (M^s/P)= 4510 De...
Question 2: Money market Suppose that the money demand function is (M/P) = 0.75 Y -...
 Question 2: Money market Suppose that the money demand function is (M/P) = 0.75 Y - 200r The money supply M is 6000 and the price level is 2. a. Graph the supply for real money balances on a new graph (label it "figure 3"), and label the supply of real money balances (M/P). g. Suppose that the income is 6000. Complete Table 1 and draw the demand for real money balances curve ((M/P'] in figure 3. Find the value...
Real interest rate, r (%) Derive the LM curve graphically given the money market diagram below...
 Real interest rate, r (%) Derive the LM curve graphically given the money market diagram below Real interest rate, r (%) MS 14 14 12 MD(Y $16,000) MD(Y $12,000) 50 110MD(Y $8,000 0 40 80 120 160 200 240 Real money supply and real money demanc 1.) Use the point drawing tool to plot three points, one for each level of real GDP Properly label each point. 0 2 4 6 8 10 12 14 16 18 20 Real GDP,...
The money market for this economy is described by the equations: (M/P) = 0.4Y - 40r...
 The money market for this economy is described by the equations: (M/P) = 0.4Y - 40r M = 1200 P=1 12. Derive a formula for the LM curve, showing Y as a function of r. 13. What are the short run values of Y and ? 14. What are the short run values of Y and rif G increases by 200? What is the multiplier? Is the value different from what you calculated for question 9? Explain why it is...
Question1 Consider the following economy of Hicksonia. 1. The consumption function is given by C ...
 Need the answer from question 5 to 9, do not put the answer from
1 to 4, please.
Question1 Consider the following economy of Hicksonia. 1. The consumption function is given by C 200 + 0.75(Y-T). The investment function is 1 = 200-2500. Government purchases and taxes are both 100. Derive the IS curve 2. The money demand function in Hicksonia is (Md/P)-Y-10000 The money supply (M) is 1,000. Derive the LM curve under an arbitrary value of P (Hint:...
Need the answer from question 5 to 9, do not put the answer from
1 to 4, please.
Question1 Consider the following economy of Hicksonia. 1. The consumption function is given by C 200 + 0.75(Y-T). The investment function is 1 = 200-2500. Government purchases and taxes are both 100. Derive the IS curve 2. The money demand function in Hicksonia is (Md/P)-Y-10000 The money supply (M) is 1,000. Derive the LM curve under an arbitrary value of P (Hint:...
1. Suppose an economy is represented by the following equations: C=500+.75(Y-T) I=1000 -50r (M/P)d=Y-200r G=1000 T=1000...
1. Suppose an economy is represented by the following equations: C=500+.75(Y-T) I=1000 -50r (M/P)d=Y-200r G=1000 T=1000 M=6000 P=2 Use these equations to derive both the IS and LM curves. Suppose that a newly elected president cuts taxes by 20%. Assuming that the money supply is held constant, what is the equilibrium interest rate in this economy? Round your answer to the nearest tenth. Do not use a percent sign when entering your answer. Your answer should not be given as...
Please box answers! Thank you. 11. Monetary policy and the LM curve Aa Aa The following graph shows the demand and supply of real money balances in a hypothetical economy. Use the black point (X point...
 Please box answers! Thank
you.
11. Monetary policy and the LM curve Aa Aa The following graph shows the demand and supply of real money balances in a hypothetical economy. Use the black point (X point) to indicate the equilibrium in this market. Dashed drop lines will automatically extend to both axes. REAL INTEREST RATE [Percent) 10 Equilibrium Supply New Supply New Equilibrium Demand 3 0 10 20 30 40 50 60 70 80 90 100 REAL MONEY BALANCES Help...
Please box answers! Thank
you.
11. Monetary policy and the LM curve Aa Aa The following graph shows the demand and supply of real money balances in a hypothetical economy. Use the black point (X point) to indicate the equilibrium in this market. Dashed drop lines will automatically extend to both axes. REAL INTEREST RATE [Percent) 10 Equilibrium Supply New Supply New Equilibrium Demand 3 0 10 20 30 40 50 60 70 80 90 100 REAL MONEY BALANCES Help...
2. The demand for money is: Mº = PYL (1), where P is the price level,...
 2. The demand for money is: Mº = PYL (1), where P is the price level, Y is the real GDP and L () is an inverse function of the rate of interest (i.e. when i increases, L (1) decreases, and vice versa). Money supply is: M$ = mH, where H is the high-powered money issued by the central bank and m is the money multiplier. (a) Draw the money demand and supply curves on a graph with money demand...
• if the velocity of money is 2, the money supply in this economy is ($4.5 trillion/ $18 trillion/ $27 trillion/ $3...
 • if the velocity of money is 2, the money supply in this
economy is ($4.5 trillion/ $18 trillion/ $27 trillion/ $36
trillion/ $45trillion /$54 trillion)
•because ( the federal reserve controls M/ velocity is assumed
to be constant/ the AD curve is downward sloping ), the percentage
increase in the price level Is ( less then/ the same as/ greater
then ) the percentage increase im the money supply. the illustrates
the ( importance of the federal reserve /...
• if the velocity of money is 2, the money supply in this
economy is ($4.5 trillion/ $18 trillion/ $27 trillion/ $36
trillion/ $45trillion /$54 trillion)
•because ( the federal reserve controls M/ velocity is assumed
to be constant/ the AD curve is downward sloping ), the percentage
increase in the price level Is ( less then/ the same as/ greater
then ) the percentage increase im the money supply. the illustrates
the ( importance of the federal reserve /...
Assume the Chilean economy can be described as follows: C=200+0.25Yd l=150+0.25Y-1000r G=250 T=200 (M/P)d= L(r, Y)...
Assume the Chilean economy can be described as follows: C=200+0.25Yd l=150+0.25Y-1000r G=250 T=200 (M/P)d= L(r, Y) = 2Y- 8000r Ms=1840 P=1 a) Derive the equation for the LM curve. ( 1 .5 mk) b) Determine the slope af the LM curve. (0.5 mark) c) Derive the equation for the IS curve (I.S mk) d) Determine the slope ofthe IS curve. (0.5 mk) c) Compute the quilibrium values of income (Y) and interest rate (R)? (2 marks) [) Calculate the value...
Question 4. Using your knowledge of IS-LM, solve the following: 8 12 1+r 1+r (a) If...
Question 4. Using your knowledge of IS-LM, solve the following: 8 12 1+r 1+r (a) If the consumption function is given by C = 100 + 0.6(Y − T ), planned investment is given by 1000 − 100r, G is equal to 100, and T is equal to 100. Solve for the IS equation (hint:Y as a function of r). The economy is a closed economy. (b) If the money supply is equal to 2000 and real money demand, (M/P)d...
 Question 2: Money market Suppose that the money demand function is (M/P) = 0.75 Y - 200r The money supply M is 6000 and the price level is 2. a. Graph the supply for real money balances on a new graph (label it "figure 3"), and label the supply of real money balances (M/P). g. Suppose that the income is 6000. Complete Table 1 and draw the demand for real money balances curve ((M/P'] in figure 3. Find the value...
 Real interest rate, r (%) Derive the LM curve graphically given the money market diagram below Real interest rate, r (%) MS 14 14 12 MD(Y $16,000) MD(Y $12,000) 50 110MD(Y $8,000 0 40 80 120 160 200 240 Real money supply and real money demanc 1.) Use the point drawing tool to plot three points, one for each level of real GDP Properly label each point. 0 2 4 6 8 10 12 14 16 18 20 Real GDP,...
 The money market for this economy is described by the equations: (M/P) = 0.4Y - 40r M = 1200 P=1 12. Derive a formula for the LM curve, showing Y as a function of r. 13. What are the short run values of Y and ? 14. What are the short run values of Y and rif G increases by 200? What is the multiplier? Is the value different from what you calculated for question 9? Explain why it is...
 Need the answer from question 5 to 9, do not put the answer from
1 to 4, please.
Question1 Consider the following economy of Hicksonia. 1. The consumption function is given by C 200 + 0.75(Y-T). The investment function is 1 = 200-2500. Government purchases and taxes are both 100. Derive the IS curve 2. The money demand function in Hicksonia is (Md/P)-Y-10000 The money supply (M) is 1,000. Derive the LM curve under an arbitrary value of P (Hint:...
Need the answer from question 5 to 9, do not put the answer from
1 to 4, please.
Question1 Consider the following economy of Hicksonia. 1. The consumption function is given by C 200 + 0.75(Y-T). The investment function is 1 = 200-2500. Government purchases and taxes are both 100. Derive the IS curve 2. The money demand function in Hicksonia is (Md/P)-Y-10000 The money supply (M) is 1,000. Derive the LM curve under an arbitrary value of P (Hint:...
 Please box answers! Thank
you.
11. Monetary policy and the LM curve Aa Aa The following graph shows the demand and supply of real money balances in a hypothetical economy. Use the black point (X point) to indicate the equilibrium in this market. Dashed drop lines will automatically extend to both axes. REAL INTEREST RATE [Percent) 10 Equilibrium Supply New Supply New Equilibrium Demand 3 0 10 20 30 40 50 60 70 80 90 100 REAL MONEY BALANCES Help...
Please box answers! Thank
you.
11. Monetary policy and the LM curve Aa Aa The following graph shows the demand and supply of real money balances in a hypothetical economy. Use the black point (X point) to indicate the equilibrium in this market. Dashed drop lines will automatically extend to both axes. REAL INTEREST RATE [Percent) 10 Equilibrium Supply New Supply New Equilibrium Demand 3 0 10 20 30 40 50 60 70 80 90 100 REAL MONEY BALANCES Help...
 2. The demand for money is: Mº = PYL (1), where P is the price level, Y is the real GDP and L () is an inverse function of the rate of interest (i.e. when i increases, L (1) decreases, and vice versa). Money supply is: M$ = mH, where H is the high-powered money issued by the central bank and m is the money multiplier. (a) Draw the money demand and supply curves on a graph with money demand...
 • if the velocity of money is 2, the money supply in this
economy is ($4.5 trillion/ $18 trillion/ $27 trillion/ $36
trillion/ $45trillion /$54 trillion)
•because ( the federal reserve controls M/ velocity is assumed
to be constant/ the AD curve is downward sloping ), the percentage
increase in the price level Is ( less then/ the same as/ greater
then ) the percentage increase im the money supply. the illustrates
the ( importance of the federal reserve /...
• if the velocity of money is 2, the money supply in this
economy is ($4.5 trillion/ $18 trillion/ $27 trillion/ $36
trillion/ $45trillion /$54 trillion)
•because ( the federal reserve controls M/ velocity is assumed
to be constant/ the AD curve is downward sloping ), the percentage
increase in the price level Is ( less then/ the same as/ greater
then ) the percentage increase im the money supply. the illustrates
the ( importance of the federal reserve /...
Most questions answered within 3 hours.
-
A statistics student finds herself struggling with a newspaper
article stating that only eighteen percent of...
asked 16 minutes ago -
People with beriberi, a disease caused by a thiamin deficiency,
have elevated levels of blood pyruvate...
asked 3 minutes ago -
PYTHON Programming Exercise 2: Create a Simple Cost Calculator
Write a program that displays input fields...
asked 9 minutes ago -
1.Seki agreed that Groupon could sell 18 hot air
balloon rides on his Magical Adventures company...
asked 10 minutes ago -
A cohort study is conducted to determine whether smoking is
associated with an increased risk of...
asked 15 minutes ago -
Create the pseudo-code/flowchart for an application class named
Monogram. Its main() method inputs three variables that...
asked 16 minutes ago -
How many liters of water are required to dissolve 1.00 g of
silver chromate? Express your...
asked 19 minutes ago -
Hot: T_inlet = 80, T_out = 65
Cold: T_inlet = 10, T_out = 25
Explain in...
asked 19 minutes ago -
Two protons fly in different directions and collide. They both
have a total energy of 1.5...
asked 28 minutes ago -
What is the oxidation number of each atom in sodium phosphate,
Na3PO4?
>>> SHOW YOUR WORK...
asked 34 minutes ago -
D company purchased goods with a list price of $60000, subject
to trade discounts of 20%...
asked 37 minutes ago -
Transposable elements make up more than 40% of the human genome
and are inserted more-or-less randomly...
asked 48 minutes ago