Need the answer from question 5 to 9, do not put the answer from
1 to 4, please.

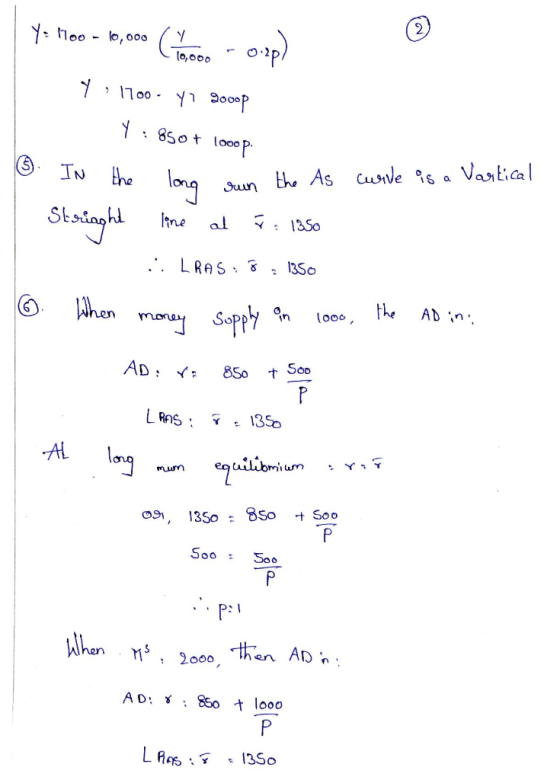
4. Suppose the money supply increases to 2,000. Derive the new LM curve and the new AD curve. (Hint: Repeat what you did for 2 and 3 with the new value of money supply.) How does this expansionary monetary policy affect the AD curve? 5. Suppose that the natural level of output (Y) is 1,350. How does the long-run AS curve ook like? 6. What are the long-run equilibrium values of output and price level when the money supply is 1,000? What are they when the money supply is 2,000? How does the expansionary monetary policy affecet the output and the price level in the long-run? 7. Consider the sticky price model. Suppose firms with flexible prices set the price following: while the firms with sticky prices follow: where a-1, E(Y-Ỹ) 0, Ỹ-1, 350 and EF-1. Suppose further that the share of firms with sticky prices, s, is 0.2. Derive the short-run AS curve. 8. Suppose that the share of firms with sticky prices, s, is 0.5 instead of 0.2. Derive the new short-run AS curve. How does s affect the slope of the short-run AS curve? 9. Again, consider the shift in the AD curve caused by the increase in the money supply (M) How does s affect the effect of the expansionary monetary policy on output in the short run?
Homework Answers


Add Answer to:
Question1 Consider the following economy of Hicksonia. 1. The consumption function is given by C ...
Consider the economy of Hicksonia a. The consumption function is given by C = 200 +...
Consider the economy of Hicksonia a. The consumption function is given by C = 200 + 0.6(Y- T). The investment function is I = 200 - 40r. Government purchases and taxes are both 100. For this economy, graph the IS curve for r changing from 0 to 8. b. The money demand function in Hicksonia is (M/P)d = Y - 100r The money supply M is 1000 and the price level P is 2. For this economy, graph the LM...
You know the following about the economy of a country: Consumption function: C = 12 +...
You know the following about the economy of a country: Consumption function: C = 12 + 0.6(YD) Government spending: G = 20 Investment function: I= 25 -50r Tax collections: T=20 Domestic price level: P = 2 Nominal money supply: MS = 360 Real Money Demand: L(r,Y)=2Y-200r Production function: Y=N Labor supply: N=100 Suppose the Federal Reserve Bank (the Fed) decides to raise interest rates to 0.14 (14%). What level of nominal money supply will achieve the Fed's target in the...
Consider the economy of Wiknam. The consumption function is given by C = 250+ 0.6(Y-T). a....
 Consider the economy of Wiknam. The consumption function is given by C = 250+ 0.6(Y-T). a. Government purchases and taxes are both 100. In the accompanying diagram, graph the IS curve for r ranging from 0 to 8 by dragging and dropping the end points to the correct locations b. The money supply M is 2,875 and the price level Pis 5. In the accompanying diagram, graph the LM curve for r ranging from 0 to 8 by dragging and...
Consider the economy of Wiknam. The consumption function is given by f. With the initial values...
 Consider the economy of Wiknam. The consumption function is given by f. With the initial values for monetary and fiscal policy, suppose that the price level falls from 5 to 3. What happens ? What are the new equilibrium interest rate and level of income? C = 250+ 0.6(Y-T). The investment function is The LM curve shifts to the by about 383.33. I = 100-20r. What are the new equilibrium interest rate and level of income? The money demand function...
1. Consider the following numerical example of the IS-LM model: C = 100 + 0.3YD I...
1. Consider the following numerical example of the IS-LM model: C = 100 + 0.3YD I = 150 + 0.2Y - 1000i T = 100 G = 200 i = .01 (M/P)s = 1200 (M/P)d = 2Y - 4000i a. Find the equation for aggregate demand (Y). b. Derive the IS relation. c. Derive the LM relation if the central bank sets an interest rate of 1%. d. Solve for the equilibrium values of output, interest rate, C and I....
please help me Consider the following numerical example of the IS-LM model: C = 100 +...
please help me Consider the following numerical example of the IS-LM model: C = 100 + 0.3YD I = 150 + 0.2Y - 1000i T = 100 G = 200 i = .01 (M/P)s = 1200 (M/P)d = 2Y - 4000i Find the equation for aggregate demand (Y). Derive the IS relation. Derive the LM relation if the central bank sets an interest rate of 1%. Solve for the equilibrium values of output, interest rate, C and I. Expansionary monetary...
Which of the followings is not one of the assumption of the new Keynesian model? Please...
Which of the followings is not one of the assumption of the new Keynesian model? Please choose one: a. Prices are flexible. b. wages are sticky c. expectations are rational D. Prices are sticky 2. The IS curve traces out the combinations of the interest rate and aggregate output for which the money market is in equilibrium, and the LM curve traces out the combinations for which the market for goods and services are in equilibrium. Select one of them: Right...
Help with graph, fill in the blanks and drop downs.Drop Downs:1. more/less2. higher/lower...
 Help with graph, fill in the blanks and drop downs.Drop Downs:1. more/less2. higher/lower3. (short-run change in output):no change/decrease/increase4. (long-run change in price level):same/lower/higher than/as initial expectations5. (long-run change in output):no change/decrease/increase4. The rational expectations model Suppose the U.S. economy is in equilibrium at a potential output of $10 trillion so that unemployment is at the natural rate. At the beginning of the year, the Federal Reserve announces that its monetary policy will aim to maintain output at potential output and sustain...
B2. Closed Economy IS-LM-FE model: The behaviour of households and firms in a closed economy is...
 B2. Closed Economy IS-LM-FE model: The behaviour of households and firms in a closed economy is represented by the following equations Desired consumptionC 200+0.8(Y-T-500r Desired investment : r = 200-500r Real money demand where expected inflation is ㎡-0.10 and taxes depend on income according to T 20+0.25Y. (a) Derive an expression for the IS curve with the real interest rate on the left side of the equation. How does the position of the IS curve depend on G? (b) If...
What reference? Name: For each of the following events, use an AD-AS diagram to show the...
 What reference?
Name: For each of the following events, use an AD-AS diagram to show the short-run and long-run effects on output and the price level (inflation rate); identify any output gap. Assume the economy starts in long run equilibrium. (1) The government reduces income taxes AS P AD (2) A decrease in consumer confidence leads to lower consumption spending AS P. AD AD-AS practice assignment.pdf 2/2 (3) The Fed decreases the money supply AS Pe K AD y* (4)...
What reference?
Name: For each of the following events, use an AD-AS diagram to show the short-run and long-run effects on output and the price level (inflation rate); identify any output gap. Assume the economy starts in long run equilibrium. (1) The government reduces income taxes AS P AD (2) A decrease in consumer confidence leads to lower consumption spending AS P. AD AD-AS practice assignment.pdf 2/2 (3) The Fed decreases the money supply AS Pe K AD y* (4)...
 Consider the economy of Wiknam. The consumption function is given by C = 250+ 0.6(Y-T). a. Government purchases and taxes are both 100. In the accompanying diagram, graph the IS curve for r ranging from 0 to 8 by dragging and dropping the end points to the correct locations b. The money supply M is 2,875 and the price level Pis 5. In the accompanying diagram, graph the LM curve for r ranging from 0 to 8 by dragging and...
 Consider the economy of Wiknam. The consumption function is given by f. With the initial values for monetary and fiscal policy, suppose that the price level falls from 5 to 3. What happens ? What are the new equilibrium interest rate and level of income? C = 250+ 0.6(Y-T). The investment function is The LM curve shifts to the by about 383.33. I = 100-20r. What are the new equilibrium interest rate and level of income? The money demand function...
 Help with graph, fill in the blanks and drop downs.Drop Downs:1. more/less2. higher/lower3. (short-run change in output):no change/decrease/increase4. (long-run change in price level):same/lower/higher than/as initial expectations5. (long-run change in output):no change/decrease/increase4. The rational expectations model Suppose the U.S. economy is in equilibrium at a potential output of $10 trillion so that unemployment is at the natural rate. At the beginning of the year, the Federal Reserve announces that its monetary policy will aim to maintain output at potential output and sustain...
 B2. Closed Economy IS-LM-FE model: The behaviour of households and firms in a closed economy is represented by the following equations Desired consumptionC 200+0.8(Y-T-500r Desired investment : r = 200-500r Real money demand where expected inflation is ㎡-0.10 and taxes depend on income according to T 20+0.25Y. (a) Derive an expression for the IS curve with the real interest rate on the left side of the equation. How does the position of the IS curve depend on G? (b) If...
 What reference?
Name: For each of the following events, use an AD-AS diagram to show the short-run and long-run effects on output and the price level (inflation rate); identify any output gap. Assume the economy starts in long run equilibrium. (1) The government reduces income taxes AS P AD (2) A decrease in consumer confidence leads to lower consumption spending AS P. AD AD-AS practice assignment.pdf 2/2 (3) The Fed decreases the money supply AS Pe K AD y* (4)...
What reference?
Name: For each of the following events, use an AD-AS diagram to show the short-run and long-run effects on output and the price level (inflation rate); identify any output gap. Assume the economy starts in long run equilibrium. (1) The government reduces income taxes AS P AD (2) A decrease in consumer confidence leads to lower consumption spending AS P. AD AD-AS practice assignment.pdf 2/2 (3) The Fed decreases the money supply AS Pe K AD y* (4)...
Most questions answered within 3 hours.
-
A marketing executive who knowingly authorizes a shoddy
defective product to be brought to market is...
asked 2 minutes ago -
Write a psudocode:
1. Define a function called authorize that takes in 2 strings,
uName, and...
asked 7 minutes ago -
What Hall voltage (in mV) is produced by a 0.180 T field applied
across a 2.60...
asked 6 minutes ago -
What mass of ethylene glycol (C2H6O2) must be added to 211.0 g
of water to obtain...
asked 9 minutes ago -
Mary's employer has a defined benefits retirement plan, which
pay 3.2% of her last year's salary...
asked 12 minutes ago -
What are the characteristics and behavior of an ethical
manager?
Explain, in your words, what ethics...
asked 29 minutes ago -
1. Which of the following is NOT an argument that McMahan uses
to show that jus...
asked 50 minutes ago -
A crate slides up a frictionless slope. At the end of 3 seconds
its velocity is...
asked 1 hour ago -
Use the following information to answer the next seven
questions.
Suppose there are three potential states...
asked 1 hour ago -
If we only have interstitial and substitutional diffusion, then
what do we consider the process of...
asked 1 hour ago -
You look at yourself in a shiny 9.6-cm-diameter Christmas tree
ball.
If your face is 21.0...
asked 1 hour ago -
If we were to measure the relaxation time of a muscle after
undergoing tetanus compared to...
asked 1 hour ago