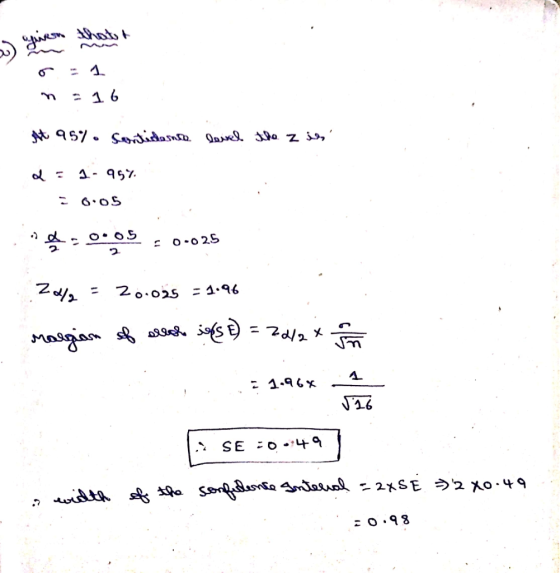
Suppose you wish to estimate the mean of a normal population using a 95% confidence interval, and...
Suppose you wish to estimate the mean of a normal population using a 95% confidence interval, and you know from prior information that σ2 ≈ 1.
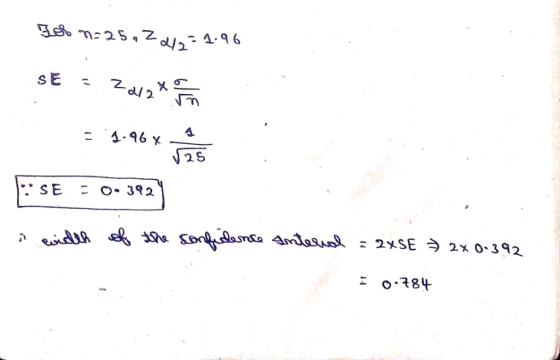
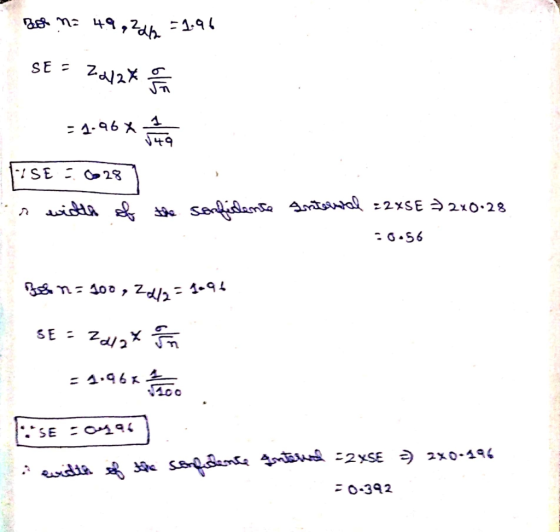
a. To see the effect of the sample size on the width of the confidence interval, calculate the width of the confidence interval for n = 16, 25, 49, 100, and 400.
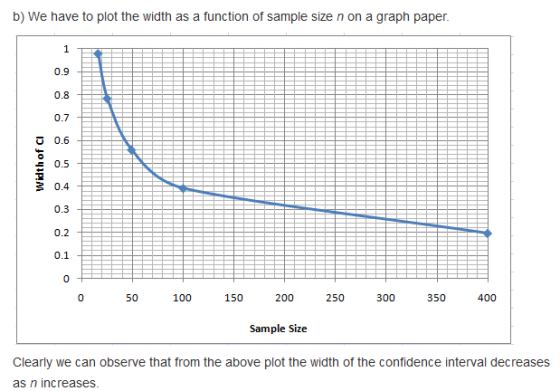
b. Plot the width as a function of sample size n on graph paper. Connect the points by a smooth curve and note how the width decreases as n increases.
Homework Answers

Add Answer to:
Suppose you wish to estimate the mean of a normal population using a 95% confidence interval, and...
If you wish to estimate a population mean to within 0.2 using a 95% confidence interval and you know from prior sampling...
If you wish to estimate a population mean to within 0.2 using a 95% confidence interval and you know from prior sampling that is approximately equal to 5.4, how many observations would you have to include in your sample? Thank You!
If you wish to estimate a population mean with a margin of error MEequals=0.33 using a...
If you wish to estimate a population mean with a margin of error MEequals=0.33 using a 95% confidence interval and you know from prior sampling that σ2 is approximately equal to 4.6 how many observations would have to be included in your sample? The number of observations that would have to be included in your sample is (______) (Round up to the nearest observation.)
Suppose you wish to estimate a population mean correct to within 0.13 with a confidence level...
Suppose you wish to estimate a population mean correct to within 0.13 with a confidence level of .90. You do not know sigma squared σ2, but you know that the observations will range in value between 32 and 40 Complete parts a and b. a. Find the approximate sample size that will produce the desired accuracy of the estimate. You wish to be conservative to ensure that the sample size will be ample for achieving the desired accuracy of the...
a. You wish to compute the 95% confidence interval for the population proportion. How large a...
a. You wish to compute the 95% confidence interval for the population proportion. How large a sample should you draw to ensure that the sample proportion does not deviate from the population proportion by more than 0.12? No prior estimate for the population proportion is available. Round intermediate calculations to at least 4 decimal places and "z" value to 3 decimal places. Round up your answer to the nearest whole number.) Sample Size - b. A business student is interested...
Suppose you take a random sample of 30 individuals from a large population. For this sample, the sample mean is 4.2 and sample variance is 49. You wish to estimate the unknown population mean µ. (a) C...
Suppose you take a random sample of 30 individuals from a large population. For this sample, the sample mean is 4.2 and sample variance is 49. You wish to estimate the unknown population mean µ. (a) Calculate a 90% confidence interval for µ. (b) Calculate a 95% confidence interval for µ. (c) Based on (a) and (b), comment on what happens to the width of a confidence interval (increase/decrease) when you increase your confidence level. (d) Suppose your sample size...
Find the margin of error for a 95% confidence interval for estimating the population mean when...
 Find the margin of error for a 95% confidence interval for estimating the population mean when the sample standard deviation equals 92, with a sample size of (a) 400,(b) 1800. What is the effect of the sample size? 2. The margin of error for a 95% confidence interval with a sample size of 400 is (Round to the nearest tenth as needed.) b. The margin of error for a 90% confidence interval with a sample size of 1600 is (Round...
Assuming that the population is normally distributed, construct a 95% confidence interval for the population mean,...
 Assuming that the population is normally distributed, construct a 95% confidence interval for the population mean, based on the following sample size of n = 5. 1, 2, 3, 4, and 30 In the given data, replace the value 30 with 5 and recalculate the confidence interval. Using these results, describe the effect of an outlier (that is, an extreme value) on the confidence interval, in general. Find a 95% confidence interval for the population mean, using the formula or...
8.1.5 Question Help Determine the 95% confidence interval estimate for the population mean of a normal...
 8.1.5 Question Help Determine the 95% confidence interval estimate for the population mean of a normal distribution given n = 100, o = 133, and x = 1,500 The 95% confidence interval for the population mean is from to (Round to two decimal places as needed. Use ascending order.) 8.1.14-T Question Help As a follow-up to a report on gas consumption, a consumer group conducted a study of SUV owners to estimate the mean mileage for their vehicles. A simple...
Suppose you construct a 95% confidence interval estimate of the true population mean by conducting a...
Suppose you construct a 95% confidence interval estimate of the true population mean by conducting a random sample of size n=100. Your sample mean x (with a bar over it) = 80.5 and your calculated maximum error of the estimate is E = 3.5. What does this suggest? Circle answer. a. in 5% of all samples of this size, the mean is more than 84, b. in 95% of all samples of this size, the mean is at least 77,...
10. Properties of a confidence interval Suppose the mean of a population is 22. A researcher...
 10. Properties of a confidence interval Suppose the mean of a population is 22. A researcher (who does not know that p Then she constructs a 95% confidence interval of the population mean. 22) selects a random sample of size n from this population. The true population mean and the researcher's 95% confidence interval of the population mean are shown in the following graph. Use the graph to answer the questions that follow Sample Mean 95% Confidence interval of the...
 Find the margin of error for a 95% confidence interval for estimating the population mean when the sample standard deviation equals 92, with a sample size of (a) 400,(b) 1800. What is the effect of the sample size? 2. The margin of error for a 95% confidence interval with a sample size of 400 is (Round to the nearest tenth as needed.) b. The margin of error for a 90% confidence interval with a sample size of 1600 is (Round...
 Assuming that the population is normally distributed, construct a 95% confidence interval for the population mean, based on the following sample size of n = 5. 1, 2, 3, 4, and 30 In the given data, replace the value 30 with 5 and recalculate the confidence interval. Using these results, describe the effect of an outlier (that is, an extreme value) on the confidence interval, in general. Find a 95% confidence interval for the population mean, using the formula or...
 8.1.5 Question Help Determine the 95% confidence interval estimate for the population mean of a normal distribution given n = 100, o = 133, and x = 1,500 The 95% confidence interval for the population mean is from to (Round to two decimal places as needed. Use ascending order.) 8.1.14-T Question Help As a follow-up to a report on gas consumption, a consumer group conducted a study of SUV owners to estimate the mean mileage for their vehicles. A simple...
 10. Properties of a confidence interval Suppose the mean of a population is 22. A researcher (who does not know that p Then she constructs a 95% confidence interval of the population mean. 22) selects a random sample of size n from this population. The true population mean and the researcher's 95% confidence interval of the population mean are shown in the following graph. Use the graph to answer the questions that follow Sample Mean 95% Confidence interval of the...
Most questions answered within 3 hours.
-
What is the difference between apoptosis and necrosis?
(b) What is the role of apoptosis in...
asked 3 minutes ago -
A galaxy is a large grouping of stars. Approximately how many
stars are in the Milky...
asked 57 minutes ago -
The Pen, Evan, and Torves Partnership has asked you to assist in
winding-up its business affairs....
asked 1 hour ago -
A) Asha Company completed its inventory count. It arrived at a
total inventory value of
$200,000....
asked 1 hour ago -
When you move a rope up and down, waves are created. If the
waves pass through...
asked 2 hours ago -
QUESTION 52
Which of the following is a direct result of scarcity?
A college student misses...
asked 2 hours ago -
The zero order reaction 2N2O→2N2+O2 has the rate constant k of
7.20×10⁻³ molL s. If the...
asked 2 hours ago -
When you borrow money to buy a house, a car, or for some other
purpose, you...
asked 2 hours ago -
Write a c program that finds the uncommon elements from two
array elements using pointers
only...
asked 2 hours ago -
SQL help:
Design a database diagram for a database that stores information
about the Downloads that...
asked 3 hours ago -
In 1970s and 1980s, molecular biologists discovered that the
hormone testosterone, binds a receptor protein that...
asked 6 hours ago -
january 1 2010 road catering service purchase a piece of
equipment for 58000 which is expected...
asked 6 hours ago