Suppose you take a random sample of 30 individuals from a large population. For this sample, the sample mean is 4.2 and sample variance is 49. You wish to estimate the unknown population mean µ. (a) C...
Suppose you take a random sample of 30 individuals from a large population. For this sample, the sample mean is 4.2 and sample variance is 49. You wish to estimate the unknown population mean µ.
(a) Calculate a 90% confidence interval for µ.
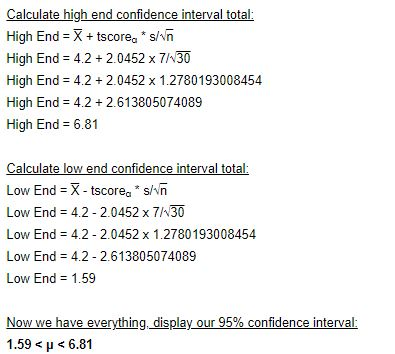
(b) Calculate a 95% confidence interval for µ.
(c) Based on (a) and (b), comment on what happens to the width of a confidence interval (increase/decrease) when you increase your confidence level.
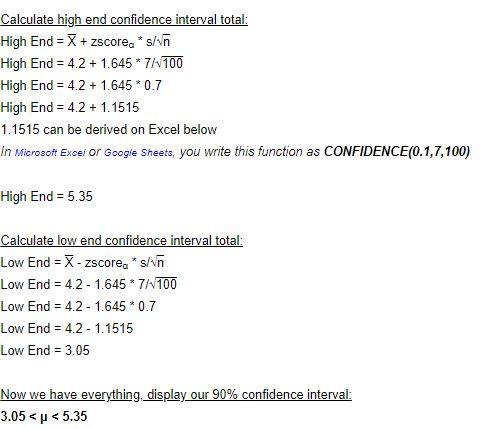
(d) Suppose your sample size is 100 instead of 30. The sample mean and variance are still 4.2 and 49 respectively. Calculate a new 90% confidence interval for µ.
(e) Based on (a) and (d), comment on what happens to the width of a confidence interval (increase/decrease) when you increase your sample size.
Homework Answers
Given that
sample n =30
sample mean μ,=4.2
sample variance σ^2= 49
standard deviation σ = 7
a)

b)
c) The width increases as the confidence level increase
d)
e)
Increasing the sample size decreases the width of confidence intervals
Add Answer to:
Suppose you take a random sample of 30 individuals from a large population. For this sample, the sample mean is 4.2 and sample variance is 49. You wish to estimate the unknown population mean µ. (a) C...
Suppose you wish to estimate the mean of a normal population using a 95% confidence interval, and...
Suppose you wish to estimate the mean of a normal population using a 95% confidence interval, and you know from prior information that σ2 ≈ 1. a. To see the effect of the sample size on the width of the confidence interval, calculate the width of the confidence interval for n = 16, 25, 49, 100, and 400. b. Plot the width as a function of sample size n on graph paper. Connect the points by a smooth curve and...
A random sample of 49 observations is used to estimate the population variance. The sample mean a...
 A random sample of 49 observations is used to estimate the population variance. The sample mean and sample standard deviation are calculated as 59 and 3.1, respectively. Assume that the population is normally distributed. (You may find it useful to reference the appropriate table: chi-square table or F table) a. Construct the 90% interval estimate for the population variance. (Round intermediate calculations to at least 4 decimal places and final answers to 2 decimal places.) Confidence interval b. Construct the...
A random sample of 43 observations is used to estimate the population variance. The sample mean...
 A random sample of 43 observations is used to estimate the population variance. The sample mean and sample standard deviation are calculated as 68.5 and 3.1, respectively. Assume that the population is normally distributed. (You may find it useful to reference the appropriate table: chi-square table or F table) a. Construct the 95% interval estimate for the population variance. (Round intermediate calculations to at least 4 decimal places and final answers to 2 decimal places.) Confidence interval to b. Construct...
A random sample of n = 25 observations is taken from a N(µ, σ ) population....
A random sample of n = 25 observations is taken from a N(µ, σ ) population. A 95% confidence interval for µ was calculated to be (42.16, 57.84). The researcher feels that this interval is too wide. You want to reduce the interval to a width at most 12 units. a) For a confidence level of 95%, calculate the smallest sample size needed. b) For a sample size fixed at n = 25, calculate the largest confidence level 100(1 −...
#3. A researcher obtained a sample mean 780 and the sample variance 49 from 121 samples....
 #3. A researcher obtained a sample mean 780 and the sample variance 49 from 121 samples. (a) Calculate the 95% confidence interval for the population mean. (b) Calculate the 99% confidence interval for the population mean.
A sample of n = 6 individuals is selected from a population with µ = 25....
A sample of n = 6 individuals is selected from a population with µ = 25. After a treatment is administered to the individuals, the sample mean is found to be M = 27. A. If the sample variance is s = 4, then conduct a hypothesis test to evaluate the significance of the treatment effect and calculate r2 to measure the size of the treatment effect. Use a two-tailed test with α = .05. B. If the sample variance...
Suppose you wish to estimate a population mean correct to within 0.13 with a confidence level...
 Suppose you wish to estimate a population mean correct to within 0.13 with a confidence level of .90. You do not know σ , but you know that the observations will range in value between 37 and 45. Complete parts a and b a. Find the approximate sample size that will produce the desired accuracy of the estimate. You wish to be conservative to ensure that the sample size will be ample for achieving the desired accuracy of the estimate....
suppose you wish to estimate a population mean correct to within 0.14 with a confidence level...
 suppose you wish to estimate a population mean correct to within 0.14 with a confidence level of .90. You do not know σ', but you know that the observations will range in value between 37 and 45. Complete parts a and b. a. Find the approximate sample size that will produce the desired accuracy of the estimate. You wish to be conservative to ensure that the sample size will be ample for achieving the desired accuracy of the estimate. (Hint:...
Suppose you wish to estimate a population mean correct to within 0.13 with a confidence level...
Suppose you wish to estimate a population mean correct to within 0.13 with a confidence level of .90. You do not know sigma squared σ2, but you know that the observations will range in value between 32 and 40 Complete parts a and b. a. Find the approximate sample size that will produce the desired accuracy of the estimate. You wish to be conservative to ensure that the sample size will be ample for achieving the desired accuracy of the...
Suppose you wish to estimate a population mean correct to within 0.14 with a confidence level...
Suppose you wish to estimate a population mean correct to within 0.14 with a confidence level of .90. You do not know sigma squaredσ2, but you know that the observations will range in value between 35 and 43. Complete parts a and b. a. Find the approximate sample size that will produce the desired accuracy of the estimate. You wish to be conservative to ensure that the sample size will be ample for achieving the desired accuracy of the estimate....
 A random sample of 49 observations is used to estimate the population variance. The sample mean and sample standard deviation are calculated as 59 and 3.1, respectively. Assume that the population is normally distributed. (You may find it useful to reference the appropriate table: chi-square table or F table) a. Construct the 90% interval estimate for the population variance. (Round intermediate calculations to at least 4 decimal places and final answers to 2 decimal places.) Confidence interval b. Construct the...
 A random sample of 43 observations is used to estimate the population variance. The sample mean and sample standard deviation are calculated as 68.5 and 3.1, respectively. Assume that the population is normally distributed. (You may find it useful to reference the appropriate table: chi-square table or F table) a. Construct the 95% interval estimate for the population variance. (Round intermediate calculations to at least 4 decimal places and final answers to 2 decimal places.) Confidence interval to b. Construct...
 #3. A researcher obtained a sample mean 780 and the sample variance 49 from 121 samples. (a) Calculate the 95% confidence interval for the population mean. (b) Calculate the 99% confidence interval for the population mean.
 Suppose you wish to estimate a population mean correct to within 0.13 with a confidence level of .90. You do not know σ , but you know that the observations will range in value between 37 and 45. Complete parts a and b a. Find the approximate sample size that will produce the desired accuracy of the estimate. You wish to be conservative to ensure that the sample size will be ample for achieving the desired accuracy of the estimate....
 suppose you wish to estimate a population mean correct to within 0.14 with a confidence level of .90. You do not know σ', but you know that the observations will range in value between 37 and 45. Complete parts a and b. a. Find the approximate sample size that will produce the desired accuracy of the estimate. You wish to be conservative to ensure that the sample size will be ample for achieving the desired accuracy of the estimate. (Hint:...
Most questions answered within 3 hours.
-
Consider the competitive environment of Starbuck's, Progressive
Insurance, a manufacturing firm with low turnover, or a...
asked 12 minutes ago -
3. Gains from trade
Consider two neighbouring island countries called Euphoria and
Contente. They each have...
asked 2 hours ago -
A business executive has the option to invest money in two
plans: Plan A guarantees that...
asked 4 hours ago -
Hello, can someone please help me answer this question?
How much heat is absorbed by a...
asked 4 hours ago -
. A marketing researcher conducted a survey of 25 shoppers
randomly selected at the local mall...
asked 4 hours ago -
Create an comprehensive response to the
following:
Antimicrobial agents work on a multitude of microbes (bacteria,...
asked 4 hours ago -
6.13 LAB: Step counter. Section 6.3.
A pedometer treats walking 2,000 steps as walking 1 mile....
asked 4 hours ago -
(14.2) A block of mass m = 10 kg riding on a frictionless
horizontal plane is...
asked 4 hours ago -
Use any search engine to search for articles about Starbucks
partnership with Tata Companies in India...
asked 4 hours ago -
Let’s say that for some reason Bank Excess Reserves suddenly
increase sharply. What effect would this...
asked 4 hours ago -
Given:
Curent Assets: $600,000
Total Assets: $2,600,000
Current Liabilities: $500,000
Total Liabilities: $1,700,000
What is the...
asked 4 hours ago -
1. What is a “Bankster”? What is insider trading? Why is it
illegal?
2. What is...
asked 4 hours ago