
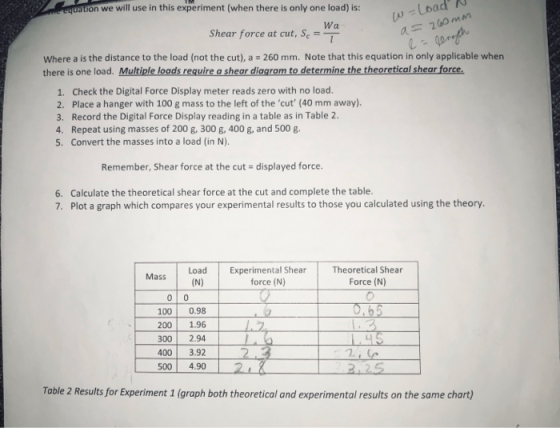
aton we will use in this experiment (when there is only one load) is: Wa 260mm Shear force at cut, SeT Where a is the distance to the load (not the cut), a 260 mm. Note that this equation in only applicable when there is one load. Multiple loads require a shear diagram to determine the theoretical shear force 1. Check the Digital Force Display meter reads zero with no load. 2. Place a hanger with 100 g mass to the left of the 'cut' (40 mm away). 3. Record the Digital Force Display reading in a table as in Table 2. 4. Repeat using masses of 200 g.300 g, 400 g, and 500 g. 5. Convert the masses into a load (in N) Remember, Shear force at the cut displayed force 6. 7. Calculate the theoretical shear force at the cut and complete the table. Plot a graph which compares your experimental results to those you calculated using the theory. Load Experimental Shear Theoretical Shear Mass force (N) Force (N) 100 0.98 200 1.96 300 2.94 400 3.92 2 500 4.90 Toble 2 Results for Experiment 1 (graph both theoretical and experimental results on the same chart)
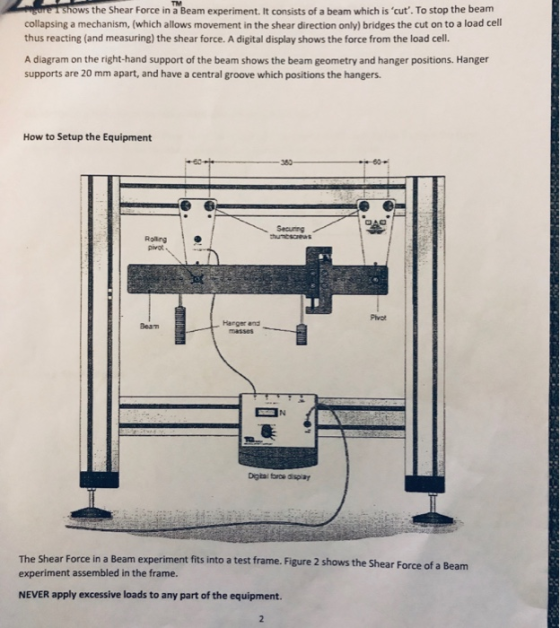
ows the Shear Force in a Beam experiment. It consists of a beam which is 'cut'. To stop the beam collapsing a mechanism, (which allows movement in the shear direction only) bridges the cut on to a load cell thus reacting (and measuring) the shear force. A digital display shows the force from the load cell. A diagram on the right-hand support of the beam shows the beam geometry and hanger positions. Hanger supports are 20 mm apart, and have a central groove which positions the hangers How to Setup the Equipment Securing Rolling Harger and masses Beam The Shear Force in a Beam experiment fits into a test frame. Figure 2 shows the Shear Force of a Beam experiment assembled in the frame. NEVER apply excessive loads to any part of the equipment
Homework Answers


Add Answer to:
The meter is only ±0.1N, lightly tap the frame (there may be a little 'stiction') Experiment 1: S...
Experiment 1: Bending Moment Variation at the point of Loading This experiment examines how bending moment...
 Experiment 1: Bending Moment Variation at the point of Loading This experiment examines how bending moment varies at the point of loading. Figure 3 shows the force diagram for the beam. Check the Digital Force Display meter reads zero with no load. Place a hanger with a 100 g mass at the cut'. Record the Digital Force Display reading in a table as in Table 1. Repeat using masses of 200 g. 300 g. 400 and 500 g Convert the...
By deatiles please! Q1. The figure shown below is extracted from bending stress in a beam experiment where an inverted Aluminum (E 69 GPa) T-section is subjected to two point-Loads (each 1/2W). The...
 By deatiles please!
Q1. The figure shown below is extracted from bending stress in a beam experiment where an inverted Aluminum (E 69 GPa) T-section is subjected to two point-Loads (each 1/2W). The strain across the depth of the cross section is measured using strain gauges which are sensors that experience a change in electrical resistance when stretched or compressed. Connections to digital strain display Beam Loading frame Pin support -Retaining pin Strain gauges Locating hole for STRBA load cel...
By deatiles please!
Q1. The figure shown below is extracted from bending stress in a beam experiment where an inverted Aluminum (E 69 GPa) T-section is subjected to two point-Loads (each 1/2W). The strain across the depth of the cross section is measured using strain gauges which are sensors that experience a change in electrical resistance when stretched or compressed. Connections to digital strain display Beam Loading frame Pin support -Retaining pin Strain gauges Locating hole for STRBA load cel...
Question I.5 Figure 1.5 shows a frame with loads at A and D. Select the closest...
 Question I.5 Figure 1.5 shows a frame with loads at A and D. Select the closest value for the magnitude of the total reaction at B. Assume the weight of the frame is zero. 40 kN VE 96.2 kN (a) (Ь -40 kN 5 m (c) -87.5 kN 30 kN (d) 57 kN 4m ao 1 m (e) 50 kN Figure L.5 Low mass frame Question I.6 In the shear and bending moment equations for beams, which of the following...
QUESTION 1 [25 marks A frame loaded with a uniformly distributed load at Member AB and...
 QUESTION 1 [25 marks A frame loaded with a uniformly distributed load at Member AB and point load at Member BC and joint B. It has pinned supports A and C, while joint B is fixed connected, as can be seen in Figure 1. Take E-200 GPa. a) Using the slope-deflection method, calculate the moments and illustrate the bending moment diagram. [15 marks) b) Then calculate the shear forces and sketch the shear force diagram. [10 marks) 22 KN 10...
help Let's consider a variation of Experiment 2 where in- stead of the system being balanced...
 help
Let's consider a variation of Experiment 2 where in- stead of the system being balanced by hanging a mass on the stick, we have the system lean against a frictionless wall (at a 30° angle relative to the hor- izontal), like a ladder except supported vertically and horizontally by an axle rather than the floor. To begin analyzing this system, label the perpendic- ular distance from the axis of rotation (chosen as the pivot point for simplicity) to the...
help
Let's consider a variation of Experiment 2 where in- stead of the system being balanced by hanging a mass on the stick, we have the system lean against a frictionless wall (at a 30° angle relative to the hor- izontal), like a ladder except supported vertically and horizontally by an axle rather than the floor. To begin analyzing this system, label the perpendic- ular distance from the axis of rotation (chosen as the pivot point for simplicity) to the...
The figure shows a mechanical device in which force (s) are applied parallel to and away...
 The figure shows a mechanical device in which force
(s) are applied parallel to and away from the axis of the main,
beam-like part. The device is supported by bearings at the
locations marked with an X, which can provide reaction forces in
any direction perpendicular to the axis of the beam. One of the
bearings has the capability of resisting horizontally directed
forces
1. Break the compound beam into parts consisting of each of the
straight components.
2. Show...
The figure shows a mechanical device in which force
(s) are applied parallel to and away from the axis of the main,
beam-like part. The device is supported by bearings at the
locations marked with an X, which can provide reaction forces in
any direction perpendicular to the axis of the beam. One of the
bearings has the capability of resisting horizontally directed
forces
1. Break the compound beam into parts consisting of each of the
straight components.
2. Show...
answer 1 b) there is u lovu 4. In a spring experiment, the results were: Load...
 answer 1
b) there is u lovu 4. In a spring experiment, the results were: Load (N) 0 1 2 3 4 5 6 7 Length (mm) 50 58 70 74 82 90 102 125 Extension (mm) a) What is the length of the spring when unstretched? b) Copy and complete the table. c) Plot a graph of extension : load. d) One of the results is wrong. Which is it? What do you think it should be? e) Mark...
answer 1
b) there is u lovu 4. In a spring experiment, the results were: Load (N) 0 1 2 3 4 5 6 7 Length (mm) 50 58 70 74 82 90 102 125 Extension (mm) a) What is the length of the spring when unstretched? b) Copy and complete the table. c) Plot a graph of extension : load. d) One of the results is wrong. Which is it? What do you think it should be? e) Mark...
Figure 3 shows a schematic arrangement of an in-line tension meter, commonly used to sense the te...
 PART B pls ty
Figure 3 shows a schematic arrangement of an in-line tension meter, commonly used to sense the tension T across a cable. The cable is routed through three pulleys (P1, P2 and Ps). As shown in Figure 3, only one of the pulleys (P2) is attached to the free end of a cantilever beam, sensorized with a set of four strain gauges in a full Wheatstone electrical configuration. The other two pulleys (P and P3) are 2...
PART B pls ty
Figure 3 shows a schematic arrangement of an in-line tension meter, commonly used to sense the tension T across a cable. The cable is routed through three pulleys (P1, P2 and Ps). As shown in Figure 3, only one of the pulleys (P2) is attached to the free end of a cantilever beam, sensorized with a set of four strain gauges in a full Wheatstone electrical configuration. The other two pulleys (P and P3) are 2...
need help with the FBD, the unknowns, and L1 and L2 thank you In this case...
 need help with the FBD, the unknowns, and L1 and L2
thank you
In this case both top and bottom supports of the PVC pipe are fixed. There is only one lever arm at the center of the pipe where torque is caused by applying weights of 5 N on each side of the hanger. Place dial gage at the point where load is applied to measure the deflection caused by it. After making the initial reading zero on the...
need help with the FBD, the unknowns, and L1 and L2
thank you
In this case both top and bottom supports of the PVC pipe are fixed. There is only one lever arm at the center of the pipe where torque is caused by applying weights of 5 N on each side of the hanger. Place dial gage at the point where load is applied to measure the deflection caused by it. After making the initial reading zero on the...
The single-story unbraced frame shown below is subjected to dead load, roof live load, and wind load Figure 1 shows the...
 The single-story unbraced frame shown below is subjected to dead load, roof live load, and wind load Figure 1 shows the results of a first-order analysis relative to the columns of the frame. The axial load and end moment (also equal to the maximum moment in the column) are given separately for the different load cases (i.e., dead load, roof live load, and lateral wind load). All vertical loads are symmetrically placed and contribute only to the Mnt moments (i.e.,...
 Experiment 1: Bending Moment Variation at the point of Loading This experiment examines how bending moment varies at the point of loading. Figure 3 shows the force diagram for the beam. Check the Digital Force Display meter reads zero with no load. Place a hanger with a 100 g mass at the cut'. Record the Digital Force Display reading in a table as in Table 1. Repeat using masses of 200 g. 300 g. 400 and 500 g Convert the...
 By deatiles please!
Q1. The figure shown below is extracted from bending stress in a beam experiment where an inverted Aluminum (E 69 GPa) T-section is subjected to two point-Loads (each 1/2W). The strain across the depth of the cross section is measured using strain gauges which are sensors that experience a change in electrical resistance when stretched or compressed. Connections to digital strain display Beam Loading frame Pin support -Retaining pin Strain gauges Locating hole for STRBA load cel...
By deatiles please!
Q1. The figure shown below is extracted from bending stress in a beam experiment where an inverted Aluminum (E 69 GPa) T-section is subjected to two point-Loads (each 1/2W). The strain across the depth of the cross section is measured using strain gauges which are sensors that experience a change in electrical resistance when stretched or compressed. Connections to digital strain display Beam Loading frame Pin support -Retaining pin Strain gauges Locating hole for STRBA load cel...
 Question I.5 Figure 1.5 shows a frame with loads at A and D. Select the closest value for the magnitude of the total reaction at B. Assume the weight of the frame is zero. 40 kN VE 96.2 kN (a) (Ь -40 kN 5 m (c) -87.5 kN 30 kN (d) 57 kN 4m ao 1 m (e) 50 kN Figure L.5 Low mass frame Question I.6 In the shear and bending moment equations for beams, which of the following...
 QUESTION 1 [25 marks A frame loaded with a uniformly distributed load at Member AB and point load at Member BC and joint B. It has pinned supports A and C, while joint B is fixed connected, as can be seen in Figure 1. Take E-200 GPa. a) Using the slope-deflection method, calculate the moments and illustrate the bending moment diagram. [15 marks) b) Then calculate the shear forces and sketch the shear force diagram. [10 marks) 22 KN 10...
 help
Let's consider a variation of Experiment 2 where in- stead of the system being balanced by hanging a mass on the stick, we have the system lean against a frictionless wall (at a 30° angle relative to the hor- izontal), like a ladder except supported vertically and horizontally by an axle rather than the floor. To begin analyzing this system, label the perpendic- ular distance from the axis of rotation (chosen as the pivot point for simplicity) to the...
help
Let's consider a variation of Experiment 2 where in- stead of the system being balanced by hanging a mass on the stick, we have the system lean against a frictionless wall (at a 30° angle relative to the hor- izontal), like a ladder except supported vertically and horizontally by an axle rather than the floor. To begin analyzing this system, label the perpendic- ular distance from the axis of rotation (chosen as the pivot point for simplicity) to the...
 The figure shows a mechanical device in which force
(s) are applied parallel to and away from the axis of the main,
beam-like part. The device is supported by bearings at the
locations marked with an X, which can provide reaction forces in
any direction perpendicular to the axis of the beam. One of the
bearings has the capability of resisting horizontally directed
forces
1. Break the compound beam into parts consisting of each of the
straight components.
2. Show...
The figure shows a mechanical device in which force
(s) are applied parallel to and away from the axis of the main,
beam-like part. The device is supported by bearings at the
locations marked with an X, which can provide reaction forces in
any direction perpendicular to the axis of the beam. One of the
bearings has the capability of resisting horizontally directed
forces
1. Break the compound beam into parts consisting of each of the
straight components.
2. Show...
 answer 1
b) there is u lovu 4. In a spring experiment, the results were: Load (N) 0 1 2 3 4 5 6 7 Length (mm) 50 58 70 74 82 90 102 125 Extension (mm) a) What is the length of the spring when unstretched? b) Copy and complete the table. c) Plot a graph of extension : load. d) One of the results is wrong. Which is it? What do you think it should be? e) Mark...
answer 1
b) there is u lovu 4. In a spring experiment, the results were: Load (N) 0 1 2 3 4 5 6 7 Length (mm) 50 58 70 74 82 90 102 125 Extension (mm) a) What is the length of the spring when unstretched? b) Copy and complete the table. c) Plot a graph of extension : load. d) One of the results is wrong. Which is it? What do you think it should be? e) Mark...
 PART B pls ty
Figure 3 shows a schematic arrangement of an in-line tension meter, commonly used to sense the tension T across a cable. The cable is routed through three pulleys (P1, P2 and Ps). As shown in Figure 3, only one of the pulleys (P2) is attached to the free end of a cantilever beam, sensorized with a set of four strain gauges in a full Wheatstone electrical configuration. The other two pulleys (P and P3) are 2...
PART B pls ty
Figure 3 shows a schematic arrangement of an in-line tension meter, commonly used to sense the tension T across a cable. The cable is routed through three pulleys (P1, P2 and Ps). As shown in Figure 3, only one of the pulleys (P2) is attached to the free end of a cantilever beam, sensorized with a set of four strain gauges in a full Wheatstone electrical configuration. The other two pulleys (P and P3) are 2...
 need help with the FBD, the unknowns, and L1 and L2
thank you
In this case both top and bottom supports of the PVC pipe are fixed. There is only one lever arm at the center of the pipe where torque is caused by applying weights of 5 N on each side of the hanger. Place dial gage at the point where load is applied to measure the deflection caused by it. After making the initial reading zero on the...
need help with the FBD, the unknowns, and L1 and L2
thank you
In this case both top and bottom supports of the PVC pipe are fixed. There is only one lever arm at the center of the pipe where torque is caused by applying weights of 5 N on each side of the hanger. Place dial gage at the point where load is applied to measure the deflection caused by it. After making the initial reading zero on the...
 The single-story unbraced frame shown below is subjected to dead load, roof live load, and wind load Figure 1 shows the results of a first-order analysis relative to the columns of the frame. The axial load and end moment (also equal to the maximum moment in the column) are given separately for the different load cases (i.e., dead load, roof live load, and lateral wind load). All vertical loads are symmetrically placed and contribute only to the Mnt moments (i.e.,...
Most questions answered within 3 hours.
-
Minitab Problem: Take the Lake Hume June rainfall data and find
use the processes outlined in...
asked 42 minutes ago -
X Company is trying to decide whether to continue using old
equipment to make Product A...
asked 43 minutes ago -
IN PYTHON ONLY !! Program 2: Re-work
program #5 (WeeklyHours) from the previous assignment such that...
asked 1 hour ago -
The average length of time between arrivals at a turnpike
toll-booth is 26 seconds. What is...
asked 2 hours ago -
(a) A piston at 6.1 atm contains a gas that occupies a volume of
3.5 L....
asked 4 hours ago -
Please answer true or false. Words
cannot be changed or added in to make it true...
asked 4 hours ago -
An empty test tube weighs 15.923 grams. Then,
MgCl2•6H2O is added into the test tube. After...
asked 4 hours ago -
Assume memory access is 10 units of time and disk access is
10000 units of time....
asked 4 hours ago -
1. Are all good samples random?
2. Magazines often report surveys giving statistics such as “63%...
asked 4 hours ago -
Under all the various types of market structures, firms
must eventually earn some economic profits for...
asked 4 hours ago -
Consider the following fitness regime for a single locus trait
with two co-dominant alleles: w11 =...
asked 4 hours ago -
A large cable company reports the following.
80% of its customers subscribe to its cable TV...
asked 4 hours ago