1. You are the new data scientist for Fitbit. When viewing the Google Analytics account associated with the Fitbit website., you notice that the Average Time on Site is 82 seconds.
- Describe 4 different ways you can provide context for this metric.
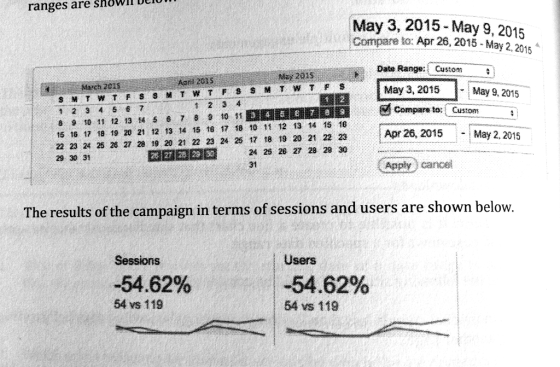
- For the sub-activity, refer to the attachment below entitled, "Image_Module_11.jpg" (the image is also embedded within the text below). Imagine that you have created an email campaign designed to drive users to your site. The email campaign took place during the week of May 3 to May 9, 2015. You want to use the week prior to your campaign as your frame of reference. The date ranges and the results of the campaign in terms of sessions and users are shown in the attached image. Does this data provide context and, if so, what is the context? Should this campaign be considered a success? Why or why not?
Homework Answers
4 ways to provide context for the metric are:
- Average time is 82 sec can implies user is staying quiet long time on site
- We can infer that response of the site might be slow
- Sometimes at the backend accessing database require good time because of many records
- Bandwidth is very less and problems of delay might arise
Yes this data provide context, according to statistics given users and sessions are 54% higher than previous week results
There is almost values 100% increase in users and sessions , so we can consider this campaign as success.
Add Answer to:
1. You are the new data scientist for Fitbit. When viewing the Google Analytics account associate...
Consider the following data. 14 21 23 20 16 19 22 26 15 16 23 25...
Consider the following data. 14 21 23 20 16 19 22 26 15 16 23 25 24 20 15 20 19 20 21 13 17 17 18 23 26 21 22 15 20 18 25 24 15 23 25 19 21 24 21 19 (a) Develop a frequency distribution using classes of 12–14, 15–17, 18–20, 21–23, and 24–26. Class Frequency 12–14 15–17 18–20 21–23 24–26 Total (b) Develop a relative frequency distribution and a percent frequency distribution using the classes...
For the data listed(assume sample). a.) Find the following: Mean Mode Median Midrange Range Quartiles Variance...
For the data listed(assume sample). a.) Find the following: Mean Mode Median Midrange Range Quartiles Variance Standard Deviation BoxPlot b.) Create a frequency distribution When creating classes use the formula from the Notes on how classes to create. 17 23 14 16 12 26 20 22 14 15 22 18 18 21 21 19 15 21 18 17 15 25 14 30 16 10 20 12 16 17.44 16 14 15 20 20 16 17 16 15 15 19 48...
Game Point_Differential Assists Rebounds Turnovers Personal_Fouls 1 15 15 38 11 9 2 36 20 43 &
 Game
Point_Differential Assists
Rebounds Turnovers Personal_Fouls
1 15 15 38
11 9
2 36 20 43
8 13
3 16 21 29
7 13
4 45 22 46
11 11
5 12 11 40
7 22
6 -10 10 31
13 26
7 11 19 45
11 7
8 12 16 32
16 14
9 3 16 27
18 15
10 19 9 34
17 17
11 40 16 41
9 17
12 44 12 29
9 22
13 16 ...
Game
Point_Differential Assists
Rebounds Turnovers Personal_Fouls
1 15 15 38
11 9
2 36 20 43
8 13
3 16 21 29
7 13
4 45 22 46
11 11
5 12 11 40
7 22
6 -10 10 31
13 26
7 11 19 45
11 7
8 12 16 32
16 14
9 3 16 27
18 15
10 19 9 34
17 17
11 40 16 41
9 17
12 44 12 29
9 22
13 16 ...
1 A measurement systems experiment involving 20 parts, three operators, and two measurements per ...
 1 A measurement systems experiment involving 20 parts, three operators, and two measurements per part is shown in Table 8E. 12. (a) Estimate the repeatability and reproducibility of the gauge (b) What is the estimate of total gauge variability? (c) If the product specifications are at LSL 6 and USIL - 60, what ca you say about gauge capa bility? TABLE 8E. 12 Measurement Data for Exercise 8.34 Operator 1 Operator 2 Operator 3 Measurements Measurements Measurements Part Number 1...
After discussing the issue with you and others in the Finance department, the manager decided to...
After discussing the issue with you and others in the Finance department, the manager decided to change the payment terms for Accounts Receivable. The payment time remained at 14 days, but the penalty for late payments was increased. After about 3 months under the new payment terms, you asked the manager to collect a second stratified random sample. The data is presented in the second column of the worksheet (see the tab titled, “Data – Case #2) under the Heading...
A soft drink manufacturer uses fire agents to handle premium distribution for is various products. The marketing director desired to study the timeliness with which the premiums are distributed. Twent...
A soft drink manufacturer uses fire agents to handle premium distribution for is various products. The marketing director desired to study the timeliness with which the premiums are distributed. Twenty transactions for each agent were selected at random and the time lapse (in days) for handling each transaction was determined. The results follow: Agent 1 Agent 2 Agent 3 Agent 4 Agent 5 24 18 10 15 33 24 20 11 13 22 29 20 8 18 28 20 24...
eBook Consider the following data. Click on the datafile logo to reference the data DATA file...
 eBook Consider the following data. Click on the datafile logo to reference the data DATA file Excel or Minitab users: The data set is available in file named Frequency. All data sets can be found on the premium online website 14 19 24 21 21 16 23 25 25 16 16 16 12 24 18 17 21 23 20 16 18 16 15 24 19 24 26 20 Summarize the data by filling in the frequency, the relative frequency (3...
14 24 18 23 21 18 16 14 23 17 15 13 19 23 24 14...
14 24 18 23 21 18 16 14 23 17 15 13 19 23 24 14 16 26 21 14 15 22 16 12 20 23 19 26 20 25 21 19 21 25 23 25 25 19 20 15 (a) Develop a frequency distribution using classes of 12-14, 15-17, 18-20, 21-23, and 24-26. Class Frequency 12-14 15-17 18-20 21-23 24-26 Total (b) Develop a relative frequency distribution and a percent frequency distribution using the classes in part (a). If...
Assembly Language Programming Assignment program must be in: MASM assembly language / x86 architecture / irvine...
Assembly Language Programming Assignment program must be in: MASM assembly language / x86 architecture / irvine library procedures Objectives: 1. using register indirect addressing 2. passing parameters 3. generating “random” numbers 4. working with arrays Description: Write and test a MASM program to perform the following tasks: 1. Introduce the program. 2. Generate ARRAYSIZE random integers in the range [LO = 10 .. HI = 29], storing them in consecutive elements of an array. ARRAYSIZE should be set to 200....
data: (copy and paste in excel to view columns in alignment) Sample Repair Time (days) 1 ...
 data: (copy and paste in excel to view columns in alignment)
Sample Repair Time (days)
1 12
2 17
3 9
4 16
5 10
6 18
7 12
8 14
9 15
10 14
11 14
12 8
13 11
14 10
15 8
16 8
17 14
18 12
19 14
20 13
21 12
22 15
23 15
24 10
25 24
26 17
27 13
28 15
29 13
30 15
31 36
32 40
33 ...
data: (copy and paste in excel to view columns in alignment)
Sample Repair Time (days)
1 12
2 17
3 9
4 16
5 10
6 18
7 12
8 14
9 15
10 14
11 14
12 8
13 11
14 10
15 8
16 8
17 14
18 12
19 14
20 13
21 12
22 15
23 15
24 10
25 24
26 17
27 13
28 15
29 13
30 15
31 36
32 40
33 ...
 Game
Point_Differential Assists
Rebounds Turnovers Personal_Fouls
1 15 15 38
11 9
2 36 20 43
8 13
3 16 21 29
7 13
4 45 22 46
11 11
5 12 11 40
7 22
6 -10 10 31
13 26
7 11 19 45
11 7
8 12 16 32
16 14
9 3 16 27
18 15
10 19 9 34
17 17
11 40 16 41
9 17
12 44 12 29
9 22
13 16 ...
Game
Point_Differential Assists
Rebounds Turnovers Personal_Fouls
1 15 15 38
11 9
2 36 20 43
8 13
3 16 21 29
7 13
4 45 22 46
11 11
5 12 11 40
7 22
6 -10 10 31
13 26
7 11 19 45
11 7
8 12 16 32
16 14
9 3 16 27
18 15
10 19 9 34
17 17
11 40 16 41
9 17
12 44 12 29
9 22
13 16 ...
 1 A measurement systems experiment involving 20 parts, three operators, and two measurements per part is shown in Table 8E. 12. (a) Estimate the repeatability and reproducibility of the gauge (b) What is the estimate of total gauge variability? (c) If the product specifications are at LSL 6 and USIL - 60, what ca you say about gauge capa bility? TABLE 8E. 12 Measurement Data for Exercise 8.34 Operator 1 Operator 2 Operator 3 Measurements Measurements Measurements Part Number 1...
 eBook Consider the following data. Click on the datafile logo to reference the data DATA file Excel or Minitab users: The data set is available in file named Frequency. All data sets can be found on the premium online website 14 19 24 21 21 16 23 25 25 16 16 16 12 24 18 17 21 23 20 16 18 16 15 24 19 24 26 20 Summarize the data by filling in the frequency, the relative frequency (3...
 data: (copy and paste in excel to view columns in alignment)
Sample Repair Time (days)
1 12
2 17
3 9
4 16
5 10
6 18
7 12
8 14
9 15
10 14
11 14
12 8
13 11
14 10
15 8
16 8
17 14
18 12
19 14
20 13
21 12
22 15
23 15
24 10
25 24
26 17
27 13
28 15
29 13
30 15
31 36
32 40
33 ...
data: (copy and paste in excel to view columns in alignment)
Sample Repair Time (days)
1 12
2 17
3 9
4 16
5 10
6 18
7 12
8 14
9 15
10 14
11 14
12 8
13 11
14 10
15 8
16 8
17 14
18 12
19 14
20 13
21 12
22 15
23 15
24 10
25 24
26 17
27 13
28 15
29 13
30 15
31 36
32 40
33 ...
Most questions answered within 3 hours.
-
Why are polymers not typically casted into products?
asked 3 minutes ago -
When rolling a die 129 times, what is the probability of rolling
a 6 no more...
asked 19 minutes ago -
4. A call option currently sells for $7.75. It has a strike
price of $85 and...
asked 8 minutes ago -
1.
You need to prepare 10.0 liters of an acid aqueous solution with a
pH of...
asked 11 minutes ago -
Along an aggregate supply curve, if the level of output is less
than the natural level...
asked 12 minutes ago -
By 2025, annual consumption in emerging markets will total $30
trillion and contribute more than ________...
asked 17 minutes ago -
At what point does reformation cease to be a viable option for
those who are oppressed...
asked 21 minutes ago -
Place letters corresponding to amounts in the proper order for
lightest to heaviest samples:
a) 2100...
asked 25 minutes ago -
Consider the multicore processor with 6 heterogeneous cores
labelled C1, C2, C3, C4, C5, and C6....
asked 28 minutes ago -
Document system components according to standards and procedures
(Implement and hand over system components) IT administrative
asked 28 minutes ago -
The college asked 700 students if they wanted a longer spring
break and 600 students said...
asked 27 minutes ago -
Determine the temperature (in Celsius) at which 1.00 mole of an
ideal gas will have a...
asked 52 minutes ago