
Homework Answers
 Output:

Add Answer to:
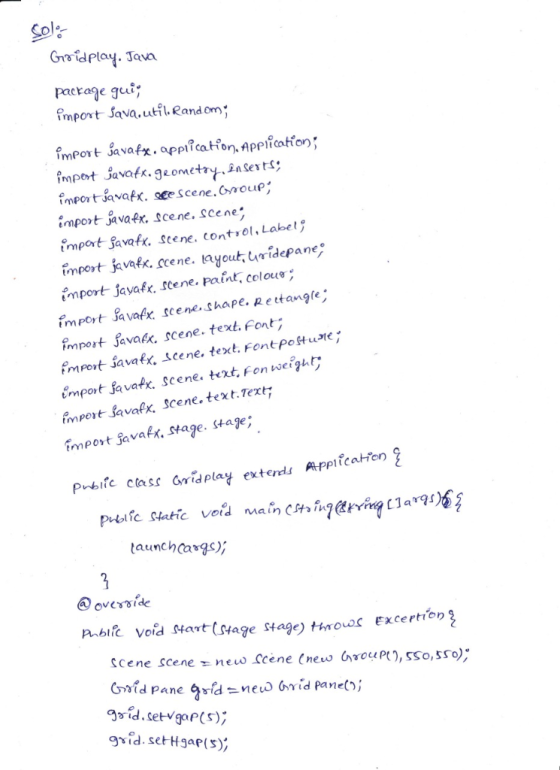
Create a JavaFX application that generates a 10 x 10 grid. Populate each cell in the grid with a ...
Consider the below matrixA, which you can copy and paste directly into Matlab.
Problem #1: Consider the below matrix A, which you can copy and paste directly into Matlab. The matrix contains 3 columns. The first column consists of Test #1 marks, the second column is Test # 2 marks, and the third column is final exam marks for a large linear algebra course. Each row represents a particular student.A = [36 45 75 81 59 73 77 73 73 65 72 78 65 55 83 73 57 78 84 31 60 83...
Please show how you did this in excel. :13-19 Every home football game for the past...
 Please show how you did this in excel.
:13-19 Every home football game for the past eight years at Eastern State University has been sold out. The revenues from ticket sales are significant, but the sale of food, beverages, and souvenirs has contrib- uted greatly to the overall profitability of the football program. One particular souvenir is the football pro- gram for each game. The number of programs sold at each game is described by the following probabil- ity distribution:...
Please show how you did this in excel.
:13-19 Every home football game for the past eight years at Eastern State University has been sold out. The revenues from ticket sales are significant, but the sale of food, beverages, and souvenirs has contrib- uted greatly to the overall profitability of the football program. One particular souvenir is the football pro- gram for each game. The number of programs sold at each game is described by the following probabil- ity distribution:...
48 57 Amy Bakery has four shops in different area in a city. Monthly sales (in...
 48 57 Amy Bakery has four shops in different area in a city. Monthly sales (in thousands of dollars) from a random of 24 months from each of the 4 shops given in Table 1. Table 1: Monthly sales (in thousands of dollars) North East South West 77 75 97 60 45 42 60 54 56 49 68 47 44 39 58 57 63 61 69 51 75 63 79 50 90 81 99 73 32 47 46 41 41...
Write a python nested for loop that prints out the following pattern 100 99 98 97...
Write a python nested for loop that prints out the following pattern 100 99 98 97 96 95 94 93 92 91 90 89 88 87 86 85 84 83 82 81 80 79 78 77 76 75 74 73 72 71 70 69 68 67 66 65 64 63 62 61 60 59 58 57 56 55 54 53 52 51 50 49 48 47 46 45 44 43 42 41 40 39 38 37 36 35 34 33...
1. Forecast demand for Year 4. a. Explain what technique you utilized to forecast your demand....
 1. Forecast demand for Year 4.
a. Explain what technique you utilized to forecast your
demand.
b. Explain why you chose this technique over others.
Year 3 Year 1 Year 2 Actual Actual Actual Forecast Forecast Forecast Demand Demand Demand Week 1 52 57 63 55 66 77 Week 2 49 58 68 69 75 65 Week 3 47 50 58 65 80 74 Week 4 60 53 58 55 78 67 57 Week 5 49 57 64 76 77...
1. Forecast demand for Year 4.
a. Explain what technique you utilized to forecast your
demand.
b. Explain why you chose this technique over others.
Year 3 Year 1 Year 2 Actual Actual Actual Forecast Forecast Forecast Demand Demand Demand Week 1 52 57 63 55 66 77 Week 2 49 58 68 69 75 65 Week 3 47 50 58 65 80 74 Week 4 60 53 58 55 78 67 57 Week 5 49 57 64 76 77...
'Student Pair' 'Standard Teaching Method' 'New Teaching Method' 1 51 67 2 72 90 3 85...
'Student Pair' 'Standard Teaching Method' 'New Teaching Method' 1 51 67 2 72 90 3 85 82 4 51 63 5 73 76 6 72 73 7 65 78 8 72 94 9 72 85 10 95 100 11 70 80 12 60 72 13 57 100 14 48 58 15 74 89 16 63 97 17 82 88 18 57 45 19 87 81 20 65 99 21 48 69 22 97 70 23 61 47 24 83 73...
RANGES FREQUENCY RELATIVE FREQUENCY CUMULATIVE REL. FREQ. 1 - 10 11 - 20 21 - 30 31 - 40...
 RANGES
FREQUENCY
RELATIVE FREQUENCY
CUMULATIVE REL. FREQ.
1 - 10
11 - 20
21 - 30
31 - 40
41 - 50
51 - 60
61 - 70
71 - 80
81 - 90
91 - 100
'= 100 DATA
VALUES??
SO, WHAT DOES A FREQUENCY TABLE TELL US?
If
you wrote each of the above data values on a ping pong ball,, put
them in a jar and blindly pulled one out:
What is the probability that this ball...
RANGES
FREQUENCY
RELATIVE FREQUENCY
CUMULATIVE REL. FREQ.
1 - 10
11 - 20
21 - 30
31 - 40
41 - 50
51 - 60
61 - 70
71 - 80
81 - 90
91 - 100
'= 100 DATA
VALUES??
SO, WHAT DOES A FREQUENCY TABLE TELL US?
If
you wrote each of the above data values on a ping pong ball,, put
them in a jar and blindly pulled one out:
What is the probability that this ball...
I need to develop the 7 functions below into the main program that's given on top...
 I need to develop the 7 functions below into the main program
that's given on top
Write a C program to create array, with random numbers and perform operations show below. Il Project 3 (53-20). 1 Projects CS5,00 This file contains the function Programcution Dagine and one include <timo // Defining some constants definer_SIZE 20 define LOVE LIMIT 1 eine UPR UNIT define TALSE eine Tut 1 wold randomizery (int[], int, Int, int) wold pinay in. St, Int); En find...
I need to develop the 7 functions below into the main program
that's given on top
Write a C program to create array, with random numbers and perform operations show below. Il Project 3 (53-20). 1 Projects CS5,00 This file contains the function Programcution Dagine and one include <timo // Defining some constants definer_SIZE 20 define LOVE LIMIT 1 eine UPR UNIT define TALSE eine Tut 1 wold randomizery (int[], int, Int, int) wold pinay in. St, Int); En find...
The index of biotic integrity (IBI) is a measure of the water quality in streams. II...
 The index of biotic integrity (IBI) is a measure of the water quality in streams. II and land-use measures for a collection of streams in the Ozark Highland ecoregion of Arkansas were collected as part of a study The data table below gives the data for 11, the percent of the watershed that was forest, and the area of the watershed in square kilometers for streams in the original sample with watershed are less than or equal to 70km? Area...
7. (a) (15 pts.) With Figure 1 below showing shifts A and B, fill in the blank Table 1 showing the computation of the...
 7. (a) (15 pts.) With Figure 1 below showing shifts A and B, fill in the blank Table 1 showing the computation of the fraction of Bin Hours in each shift for the different time groups. VI V IV Group 1 A 9-12 13-16 17-20 21-24 Sunday Monday Tuesday Wednesday B B Thursday Friday Saturday Figure 1 Table 1 Computation of Fraction of Bin Hours in Each Shift Days Total in Shift A Fraction in Each Shift B Fraction in...
 Please show how you did this in excel.
:13-19 Every home football game for the past eight years at Eastern State University has been sold out. The revenues from ticket sales are significant, but the sale of food, beverages, and souvenirs has contrib- uted greatly to the overall profitability of the football program. One particular souvenir is the football pro- gram for each game. The number of programs sold at each game is described by the following probabil- ity distribution:...
Please show how you did this in excel.
:13-19 Every home football game for the past eight years at Eastern State University has been sold out. The revenues from ticket sales are significant, but the sale of food, beverages, and souvenirs has contrib- uted greatly to the overall profitability of the football program. One particular souvenir is the football pro- gram for each game. The number of programs sold at each game is described by the following probabil- ity distribution:...
 48 57 Amy Bakery has four shops in different area in a city. Monthly sales (in thousands of dollars) from a random of 24 months from each of the 4 shops given in Table 1. Table 1: Monthly sales (in thousands of dollars) North East South West 77 75 97 60 45 42 60 54 56 49 68 47 44 39 58 57 63 61 69 51 75 63 79 50 90 81 99 73 32 47 46 41 41...
 1. Forecast demand for Year 4.
a. Explain what technique you utilized to forecast your
demand.
b. Explain why you chose this technique over others.
Year 3 Year 1 Year 2 Actual Actual Actual Forecast Forecast Forecast Demand Demand Demand Week 1 52 57 63 55 66 77 Week 2 49 58 68 69 75 65 Week 3 47 50 58 65 80 74 Week 4 60 53 58 55 78 67 57 Week 5 49 57 64 76 77...
1. Forecast demand for Year 4.
a. Explain what technique you utilized to forecast your
demand.
b. Explain why you chose this technique over others.
Year 3 Year 1 Year 2 Actual Actual Actual Forecast Forecast Forecast Demand Demand Demand Week 1 52 57 63 55 66 77 Week 2 49 58 68 69 75 65 Week 3 47 50 58 65 80 74 Week 4 60 53 58 55 78 67 57 Week 5 49 57 64 76 77...
 RANGES
FREQUENCY
RELATIVE FREQUENCY
CUMULATIVE REL. FREQ.
1 - 10
11 - 20
21 - 30
31 - 40
41 - 50
51 - 60
61 - 70
71 - 80
81 - 90
91 - 100
'= 100 DATA
VALUES??
SO, WHAT DOES A FREQUENCY TABLE TELL US?
If
you wrote each of the above data values on a ping pong ball,, put
them in a jar and blindly pulled one out:
What is the probability that this ball...
RANGES
FREQUENCY
RELATIVE FREQUENCY
CUMULATIVE REL. FREQ.
1 - 10
11 - 20
21 - 30
31 - 40
41 - 50
51 - 60
61 - 70
71 - 80
81 - 90
91 - 100
'= 100 DATA
VALUES??
SO, WHAT DOES A FREQUENCY TABLE TELL US?
If
you wrote each of the above data values on a ping pong ball,, put
them in a jar and blindly pulled one out:
What is the probability that this ball...
 I need to develop the 7 functions below into the main program
that's given on top
Write a C program to create array, with random numbers and perform operations show below. Il Project 3 (53-20). 1 Projects CS5,00 This file contains the function Programcution Dagine and one include <timo // Defining some constants definer_SIZE 20 define LOVE LIMIT 1 eine UPR UNIT define TALSE eine Tut 1 wold randomizery (int[], int, Int, int) wold pinay in. St, Int); En find...
I need to develop the 7 functions below into the main program
that's given on top
Write a C program to create array, with random numbers and perform operations show below. Il Project 3 (53-20). 1 Projects CS5,00 This file contains the function Programcution Dagine and one include <timo // Defining some constants definer_SIZE 20 define LOVE LIMIT 1 eine UPR UNIT define TALSE eine Tut 1 wold randomizery (int[], int, Int, int) wold pinay in. St, Int); En find...
 The index of biotic integrity (IBI) is a measure of the water quality in streams. II and land-use measures for a collection of streams in the Ozark Highland ecoregion of Arkansas were collected as part of a study The data table below gives the data for 11, the percent of the watershed that was forest, and the area of the watershed in square kilometers for streams in the original sample with watershed are less than or equal to 70km? Area...
 7. (a) (15 pts.) With Figure 1 below showing shifts A and B, fill in the blank Table 1 showing the computation of the fraction of Bin Hours in each shift for the different time groups. VI V IV Group 1 A 9-12 13-16 17-20 21-24 Sunday Monday Tuesday Wednesday B B Thursday Friday Saturday Figure 1 Table 1 Computation of Fraction of Bin Hours in Each Shift Days Total in Shift A Fraction in Each Shift B Fraction in...
Most questions answered within 3 hours.
-
How could meeting industry expectations, propel managers into
challenging and possible conflict of interest situations? How...
asked 13 minutes ago -
You have been married to your spouse for 10 years. You have two
small children (ages...
asked 2 hours ago -
Spiderman makes a leap from one building to
another. He starts on one building that is...
asked 2 hours ago -
A
symbol is something that stands for something else. What are the
symbols in education?what are...
asked 2 hours ago -
The charge to the left in the figure above has a
magnitude of 2.90 nC, and...
asked 3 hours ago -
Verify the MIRR is 9.29% given cash flows in years 1 and 2 of
$1,000 each,...
asked 4 hours ago -
Calculate the pH of a 5.7 M solution of aniline (C6H5NH2; Kb =
3.8 x 10^-10)
asked 6 hours ago -
LSL R3, R3, R12
Memory
Address
Orig.
Data
Updated
Data
Register
Orig.
Data
Updated
Data
0x84F0...
asked 6 hours ago -
Air at 100 kPa and density of 1.2 kg/m3 flows upward through a
5-cm diameter inclined...
asked 6 hours ago -
Define the following concepts in your own words: (a) stiffness,
(b) strength, (c) strain,
(d) ductility,...
asked 7 hours ago -
In C++
In this homework, you will be tasked with creating functions to
manipulate strings that...
asked 8 hours ago -
An isolated colony represents a pure culture. one rare occasions
, however , a colony can...
asked 8 hours ago