

![Question 12 (4 points) a) [2 pts] Calculate the null standard error for the difference in sample proportions. Round your answ](http://img.homeworklib.com/images/d2184d57-df0b-4218-97ef-d9983490dc0b.png?x-oss-process=image/resize,w_560)


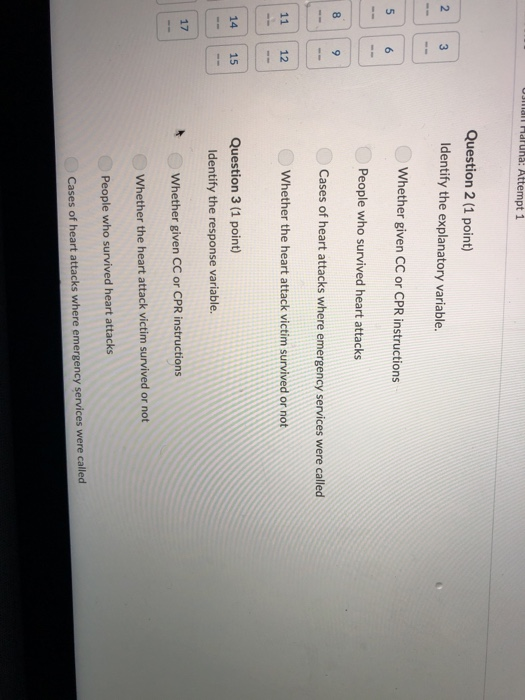
nal Haruha: Attempt 1 Question 2 (1 point) 2 Identify the explanatory variable. Whether given CC or CPR instructions People who survived heart attacks Cases of heart attacks where emergency services were called Whether the heart attack victim survived or not 6 8 9 11 12 14 15 Question 3 (1 point) Identify the response variable. 17 Whether given CC or CPR instructions Whether the heart attack victim survived or not People who survived heart attacks Cases of heart attacks where emergency services were called
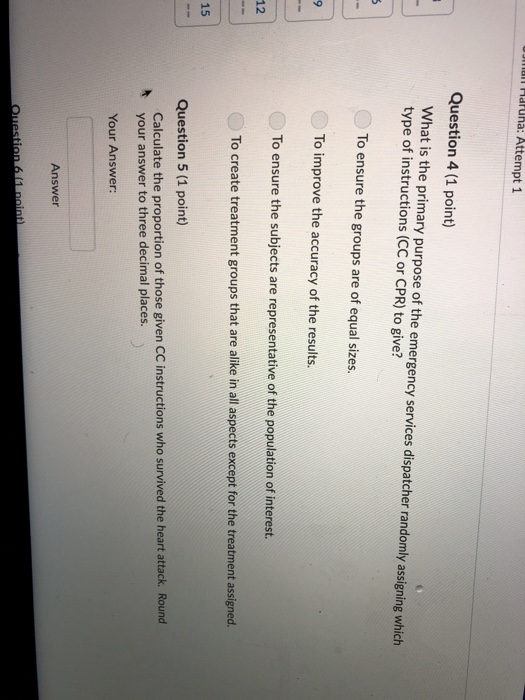
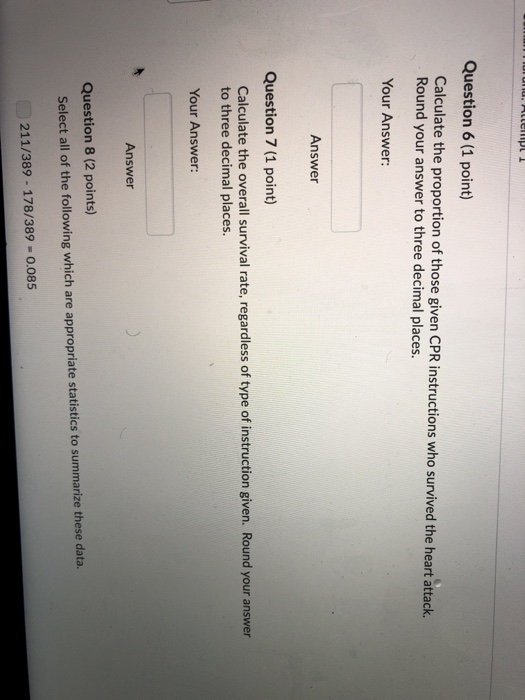
Question 6 (1 point) Calculate the proportion of those given CPR instructions who survived the heart attack. Round your answer to three decimal places. Your Answer: Answer Question 7 (1 point) Calculate the overall survival rate, regardless of type of instruction given. Round your answer to three decimal places. Your Answer Answer Question 8 (2 points) Select all of the following which are appropriate statistics to summarize these data. 211/389-178/389 -0.085
Question 8 (2 points) Select all of the following which are appropriate statistics to summarize these data. 211/389-178/389 = 0.085 389/3031 0.128 (211/1500)/(178/1531) 1.21 211/3031 178/3031 0.011 211/1500-178/1531 = 0.024 Question 9 (2 points) Select all of the following which are appropriate ways to denote the null hypothesis for these data.
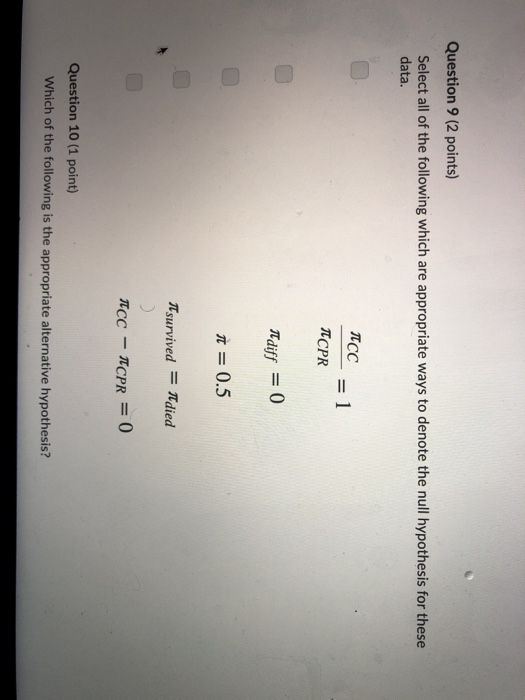
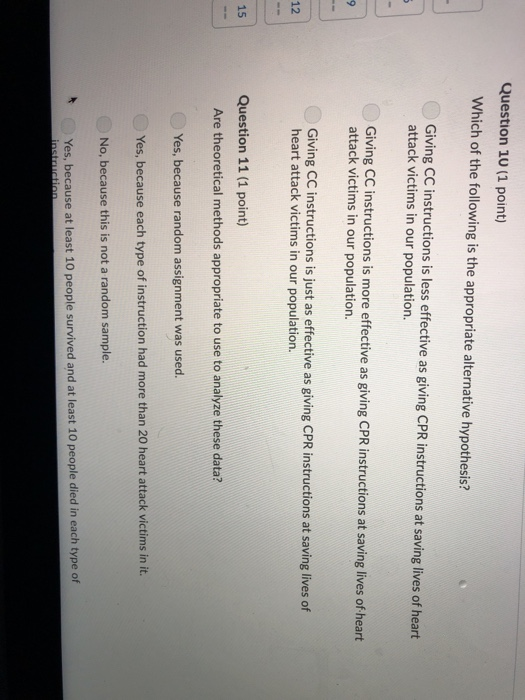
Question 9 (2 points) Select all of the following which are appropriate ways to denote the null hypothesis for these data. TCC π = 0.5 jt survived πdi Tdied Question 10 (1 point) Which of the following is the appropriate alternative hypothesis?
Question 12 (4 points) a) [2 pts] Calculate the null standard error for the difference in sample proportions. Round your answer to three decimal places. b) [2 pts] Use part (a) to calculate the standardized statistic for these data. Round your answer to three decimal places. Question 13 (1 point) Which of the following is the best interpretation of the null standard error for the difference in
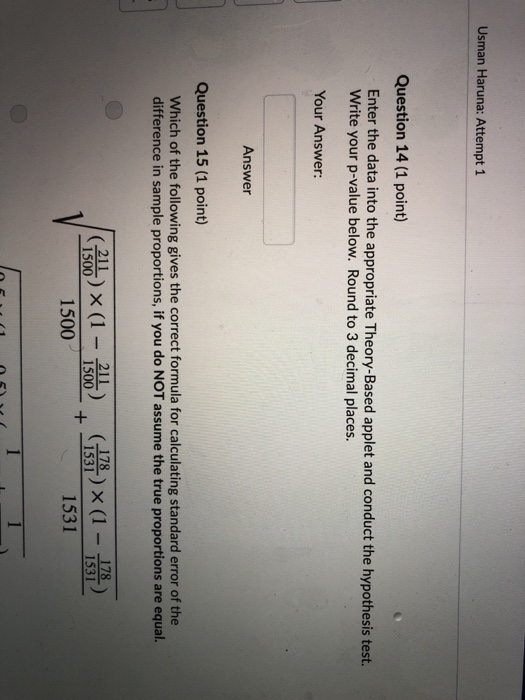
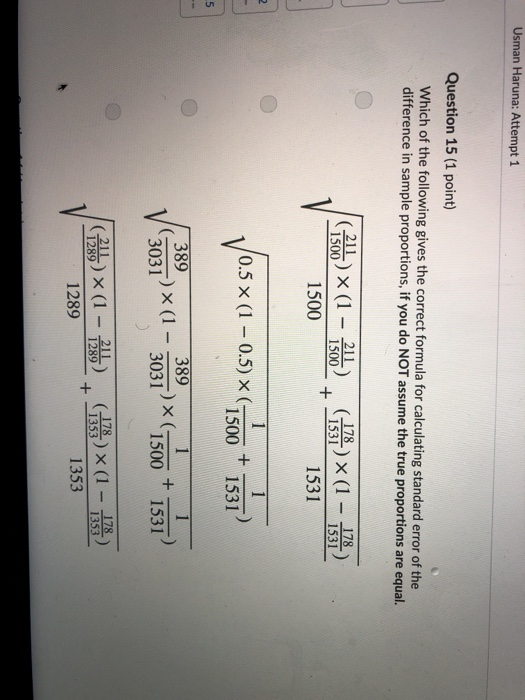
Usman Haruna: Attempt 1 Question 14 (1 point) Enter the data into the appropriate Theory-Based applet and conduct the hypothesis test. Write your p-value below. Round to 3 decimal places. Your Answer Answer Question 15 (1 point) Which of the following gives the correct formula for calculating standard error of the difference in sample proportions, if you do NOT assume the true proportions are equal. 0x (00131 15 211 1500 78 1531 78 1531 211 1500 1531
Homework Answers


As per HomeworkLib policy we need to slove 4 sub parts per post, please post the remaining question in another post.
Add Answer to:
Use the following data for the entirety of this quiz. Researchers combined the results from three...
Please write the answers clear and easy to be read and please sipirt the answers so It would be i...
 Please write the answers clear and easy to be read and please sipirt the answers so It would be in order Researchers combined the results from three experiments to investigate whether chest compression only (CC) would improve a heart attack victim's chance of survival compared to standard cardiopulmonary resuscitation (CPR). In each experiment, the emergency services dispatcher randomly assigned either the CC or CPR instructions to a bystander who was at a site where a person had just experienced a...
I need help from 9-11. I calculated 7-8 below. 7)Alcohol Consumption (liters/person/year): 3 Heart disease = 260.56-22.969(3) = 191.653 8) Alcohol Consumption (liters/pers...
 I need help from 9-11.
I calculated 7-8 below.
7)Alcohol Consumption (liters/person/year): 3
Heart disease =
260.56-22.969(3)
= 191.653
8) Alcohol Consumption (liters/person/year): 15
Heart disease =
260.56-22.969(15)
= -83.975
It wouldn’t be appropriate because the heart disease is
in -83.975.
The following table presents data on wine consumption (in liters per person per year) and death rate from heart attacks (in deaths per 100,000 people per year) in 19 developed Western countries. WINE CONSUMPTION AND HEART ATTACKS Alcohol Heart...
I need help from 9-11.
I calculated 7-8 below.
7)Alcohol Consumption (liters/person/year): 3
Heart disease =
260.56-22.969(3)
= 191.653
8) Alcohol Consumption (liters/person/year): 15
Heart disease =
260.56-22.969(15)
= -83.975
It wouldn’t be appropriate because the heart disease is
in -83.975.
The following table presents data on wine consumption (in liters per person per year) and death rate from heart attacks (in deaths per 100,000 people per year) in 19 developed Western countries. WINE CONSUMPTION AND HEART ATTACKS Alcohol Heart...
A researcher knows the average weight of American men between the ages of 30 and 50...
A researcher knows the average weight of American men between the ages of 30 and 50 is 154 pounds. For a random sample of heart patients, body weights are recorded. The data are as follows: 135, 178, 213, 180, 180, 182, 210, 187, 170, 189, 232, 153, 169, 195, 183, 153, 206, 195, 225, 199, and 167. The researcher would like to determine if men who have heart attacks between those ages are heavier than the average 30 to 50-year-old...
The following table presents data on wine consumption (in liters per person per year) and death...
 The following table presents data on wine consumption (in liters per person per year) and death rate from heart attacks (in deaths per 100,000 people per year) in 19 developed Western countries. WINE CONSUMPTION AND HEART ATTACKS Heart divae Country 131 24 Denmark United Sues Wea German 79 Answer each question/complete the tasks. (point value is in parentheses) 1. What is the explanatory variable and what is the response variable? (2) 2. Make a complete scatterplot of the data. (3)...
For each of the following three scenarios, state which hypothesis test you would use from among...
For each of the following three scenarios, state which hypothesis test you would use from among the four: the z test, the single-sample t test, the paired-samples t test, and the independent-samples t test. Explain each answer in detail, including a discussion of the type of test, why it should be used, and the assumptions of the test. A. A study of 40 children who had survived a brain tumor revealed that the children were more likely to have behavioral...
Please answer all parts. I am sorry image is upside down betic patients? Simulated rosiglitazone 1.70...
 Please answer all parts. I am sorry image is upside down
betic patients? Simulated rosiglitazone 1.70 Heart transplants. The Stanford University Heart Transplant Study ws pach patient conducted to t Study w determine whether an experimental heart transplant program increased entering the program was designated an official heart transplant candidate, mean gravely ill and would most likely benefit from a new heart. Some patients go some did not. The variable transplant indicates which group the patients were treatment group got...
Please answer all parts. I am sorry image is upside down
betic patients? Simulated rosiglitazone 1.70 Heart transplants. The Stanford University Heart Transplant Study ws pach patient conducted to t Study w determine whether an experimental heart transplant program increased entering the program was designated an official heart transplant candidate, mean gravely ill and would most likely benefit from a new heart. Some patients go some did not. The variable transplant indicates which group the patients were treatment group got...
Question 1 of 4 For the following observed and expected frequencies: Observed 39 43 42 109 Expected 38 48 45 S 6 Download data Test the hypothesis that the distribution of the observed fr...
 Question 1 of 4 For the following observed and expected frequencies: Observed 39 43 42 109 Expected 38 48 45 S 6 Download data Test the hypothesis that the distribution of the observed frequencies is as given by the expected frequencies. Use thea -0.025 level of significance and theP-value method with the TI-84 calculator Part 1 State the null and alternate hypotheses. Ho: The distribution of the observed frequencies ts H1: The distribution of the observed frequencies differs from that...
worth 1 point. 15 points maximum) Extra Credit Answer the following questions. (Each blan From the data oblained on page 4 in problems 4150, use the Schefje test to determine which of the three...
 worth 1 point. 15 points maximum) Extra Credit Answer the following questions. (Each blan From the data oblained on page 4 in problems 4150, use the Schefje test to determine which of the three treatments are significantly different from each other. The last blank in each comparison is to show either "significant" or "not significant" Treatment 1 vs. Treatment 2 Conclusion: Treatment 1 vs. Treatment 3 Conclusion: Treatment 2 vs. Treatment 3 Conclusion: For problems # 40-39, refer to the...
photos for each question are all in a row (1 point) In the following questions, use...
 photos for each question are all in a row
(1 point) In the following questions, use the normal distribution to find a confidence interval for a difference in proportions pu - P2 given the relevant sample results. Give the best point estimate for p. - P2, the margin of error, and the confidence interval. Assume the results come from random samples. Give your answers to 4 decimal places. 300. Use 1. A 80% interval for pı - P2 given that...
photos for each question are all in a row
(1 point) In the following questions, use the normal distribution to find a confidence interval for a difference in proportions pu - P2 given the relevant sample results. Give the best point estimate for p. - P2, the margin of error, and the confidence interval. Assume the results come from random samples. Give your answers to 4 decimal places. 300. Use 1. A 80% interval for pı - P2 given that...
Worksheet: Chi Square and Correlation Suppose we have three categories A, B, and C. Assume that...
 Worksheet: Chi Square and Correlation Suppose we have three categories A, B, and C. Assume that the historical distribution of observations among these four categories is 20%, 40%, and 40% respectively. A sample of size 250 is taken, and we find 75 observations in category A, 125 in category B, and 50 in category C 1. a. State the null hypothesis for the Chi-square goodness-of-fit test. b. What are the expected frequencies for each category? c. Calculate the χ 2...
 Please write the answers clear and easy to be read and please sipirt the answers so It would be in order Researchers combined the results from three experiments to investigate whether chest compression only (CC) would improve a heart attack victim's chance of survival compared to standard cardiopulmonary resuscitation (CPR). In each experiment, the emergency services dispatcher randomly assigned either the CC or CPR instructions to a bystander who was at a site where a person had just experienced a...
 I need help from 9-11.
I calculated 7-8 below.
7)Alcohol Consumption (liters/person/year): 3
Heart disease =
260.56-22.969(3)
= 191.653
8) Alcohol Consumption (liters/person/year): 15
Heart disease =
260.56-22.969(15)
= -83.975
It wouldn’t be appropriate because the heart disease is
in -83.975.
The following table presents data on wine consumption (in liters per person per year) and death rate from heart attacks (in deaths per 100,000 people per year) in 19 developed Western countries. WINE CONSUMPTION AND HEART ATTACKS Alcohol Heart...
I need help from 9-11.
I calculated 7-8 below.
7)Alcohol Consumption (liters/person/year): 3
Heart disease =
260.56-22.969(3)
= 191.653
8) Alcohol Consumption (liters/person/year): 15
Heart disease =
260.56-22.969(15)
= -83.975
It wouldn’t be appropriate because the heart disease is
in -83.975.
The following table presents data on wine consumption (in liters per person per year) and death rate from heart attacks (in deaths per 100,000 people per year) in 19 developed Western countries. WINE CONSUMPTION AND HEART ATTACKS Alcohol Heart...
 The following table presents data on wine consumption (in liters per person per year) and death rate from heart attacks (in deaths per 100,000 people per year) in 19 developed Western countries. WINE CONSUMPTION AND HEART ATTACKS Heart divae Country 131 24 Denmark United Sues Wea German 79 Answer each question/complete the tasks. (point value is in parentheses) 1. What is the explanatory variable and what is the response variable? (2) 2. Make a complete scatterplot of the data. (3)...
 Please answer all parts. I am sorry image is upside down
betic patients? Simulated rosiglitazone 1.70 Heart transplants. The Stanford University Heart Transplant Study ws pach patient conducted to t Study w determine whether an experimental heart transplant program increased entering the program was designated an official heart transplant candidate, mean gravely ill and would most likely benefit from a new heart. Some patients go some did not. The variable transplant indicates which group the patients were treatment group got...
Please answer all parts. I am sorry image is upside down
betic patients? Simulated rosiglitazone 1.70 Heart transplants. The Stanford University Heart Transplant Study ws pach patient conducted to t Study w determine whether an experimental heart transplant program increased entering the program was designated an official heart transplant candidate, mean gravely ill and would most likely benefit from a new heart. Some patients go some did not. The variable transplant indicates which group the patients were treatment group got...
 Question 1 of 4 For the following observed and expected frequencies: Observed 39 43 42 109 Expected 38 48 45 S 6 Download data Test the hypothesis that the distribution of the observed frequencies is as given by the expected frequencies. Use thea -0.025 level of significance and theP-value method with the TI-84 calculator Part 1 State the null and alternate hypotheses. Ho: The distribution of the observed frequencies ts H1: The distribution of the observed frequencies differs from that...
 worth 1 point. 15 points maximum) Extra Credit Answer the following questions. (Each blan From the data oblained on page 4 in problems 4150, use the Schefje test to determine which of the three treatments are significantly different from each other. The last blank in each comparison is to show either "significant" or "not significant" Treatment 1 vs. Treatment 2 Conclusion: Treatment 1 vs. Treatment 3 Conclusion: Treatment 2 vs. Treatment 3 Conclusion: For problems # 40-39, refer to the...
 photos for each question are all in a row
(1 point) In the following questions, use the normal distribution to find a confidence interval for a difference in proportions pu - P2 given the relevant sample results. Give the best point estimate for p. - P2, the margin of error, and the confidence interval. Assume the results come from random samples. Give your answers to 4 decimal places. 300. Use 1. A 80% interval for pı - P2 given that...
photos for each question are all in a row
(1 point) In the following questions, use the normal distribution to find a confidence interval for a difference in proportions pu - P2 given the relevant sample results. Give the best point estimate for p. - P2, the margin of error, and the confidence interval. Assume the results come from random samples. Give your answers to 4 decimal places. 300. Use 1. A 80% interval for pı - P2 given that...
 Worksheet: Chi Square and Correlation Suppose we have three categories A, B, and C. Assume that the historical distribution of observations among these four categories is 20%, 40%, and 40% respectively. A sample of size 250 is taken, and we find 75 observations in category A, 125 in category B, and 50 in category C 1. a. State the null hypothesis for the Chi-square goodness-of-fit test. b. What are the expected frequencies for each category? c. Calculate the χ 2...
Most questions answered within 3 hours.
-
For the following reaction, 0.128 moles of
potassium hydrogen sulfateare mixed with
0.504 moles of potassium...
asked 3 hours ago -
1. What is the present value of $400, three years in the future
if the interest...
asked 3 hours ago -
The labor force minus the number of employed equals the number
of unemployed.
a. True
b....
asked 5 hours ago -
Determine the mass in units of grams [g] of 0.49 moles [mol]
of a new fictitious...
asked 6 hours ago -
A horizontal mass of M=5kg is on a spring and stretched to
x=0.5m when released from...
asked 7 hours ago -
26 of 50
"I have worked at the Arizona Humane Society for ten years, and
have...
asked 7 hours ago -
Compare and contrast zero based budgeting and incremental (or
base year) budgeting.
asked 7 hours ago -
4 pts 10. Which of the following hypothesis would be MOST
difficult to test experimentally? Group...
asked 7 hours ago -
A business owner makes 1,000 items a day. Each day he or she
contributes eight hours...
asked 7 hours ago -
A
circular loop in the plane of a paper lies inca0.65 T magnetic
field pointing into...
asked 8 hours ago -
A business owner is trying to decide whether to buy, rent, or
lease office space and...
asked 8 hours ago -
Thermal Storage Solar heating of a house is much more efficient
if there is a way...
asked 8 hours ago