

Bode plots for Question 4 (Part c) -20 -40 -60 -80 -100 120 -140 10 10 102 10 Frequency (rad/sec) 10 10 -150.. -200 10 101 102 10 10 10 Frequenoy (rad/seo)
Homework Answers
In this solution some basic concepts of Vibration Mechanics are used. For more information, refer to any standard textbook or drop a comment below. Please give a positive rating if solution is helpful.


NOTE : Feel free to ask
further queries. Your positive rating would be appreciated and
motivate me !
Add Answer to:
QUESTION 4 This question will reinforce how the Bode plot provides the steady-state response for ...
The transfer function of the given physical system is 2500 Gp(s)-T-1000 Part 3 1. Frequency response (a) Draw the bode...
 The transfer function of the given physical system is 2500 Gp(s)-T-1000 Part 3 1. Frequency response (a) Draw the bode plot of open-loop transfer function when K (b) Use bode plot of open-loop transfer function to determine the type of system (do not use transfer function) (c) For what input the system will have constant steady-state error (d) for the unit input in item (c) calculate the constant steady-state error.(Use bode plot to calculate the error.) (e) Design a lead...
4. Draw the magnitude characteristic of the Bode plot of the following transfer function: 10s H...
 4. Draw the magnitude characteristic of the Bode plot of the following transfer function: 10s H (s) =-= (s+1)(s+102 L7n Identify the poles and zeros Sketch the magnitude plot. The y-axis should be in dB. The x-axis should logarithmic, but labeled in rad/sec Use MATLAB to draw the complete Bode plot and check your answer. If the input current is un(t) = 2 cos(20t + 5°), what is the output voltage. Use your MATLAB Bode plot to answer this a)...
QUESTION 2 Consider this 2" order transfer function which was discussed in lecture G(s) 10s+9 The Bode plots (magnitude, phase) for this G(s) are provided in this handout. For the following...
 QUESTION 2 Consider this 2" order transfer function which was discussed in lecture G(s) 10s+9 The Bode plots (magnitude, phase) for this G(s) are provided in this handout. For the following frequency (i.e."o") values, do complex number calculations as performed in lecture, to verify that this magnitude curve (in decibels) and phase curve (in degrees) are correct “o',-0.03, 0.2, 1, 6, 20, and 60 rad/sec Be sure to show your work CLEARLY, and indicate on the Bode plots the magnitude/phase...
Problem 4: (30) From the given Bode magnitude diagram, (a) Construct the transfer function G(s). 1), find the steady-state response y (b) If input utos(0.l ) The slope of 20logolG jo) at ω < 0.-th...
 Problem 4: (30) From the given Bode magnitude diagram, (a) Construct the transfer function G(s). 1), find the steady-state response y (b) If input utos(0.l ) The slope of 20logolG jo) at ω < 0.-the slope of 2010giolG jo) at 0.1 < ω < I The slope of 201°golG jo) at ω > 4000-the slope of 2010giolGUo) at 400 < ω < 4000 20log1G(jo) -40 60 80 10 10' 4 10 40 10 400 10 4000 10 w(rad/sec)
Problem 4:...
Problem 4: (30) From the given Bode magnitude diagram, (a) Construct the transfer function G(s). 1), find the steady-state response y (b) If input utos(0.l ) The slope of 20logolG jo) at ω < 0.-the slope of 2010giolG jo) at 0.1 < ω < I The slope of 201°golG jo) at ω > 4000-the slope of 2010giolGUo) at 400 < ω < 4000 20log1G(jo) -40 60 80 10 10' 4 10 40 10 400 10 4000 10 w(rad/sec)
Problem 4:...
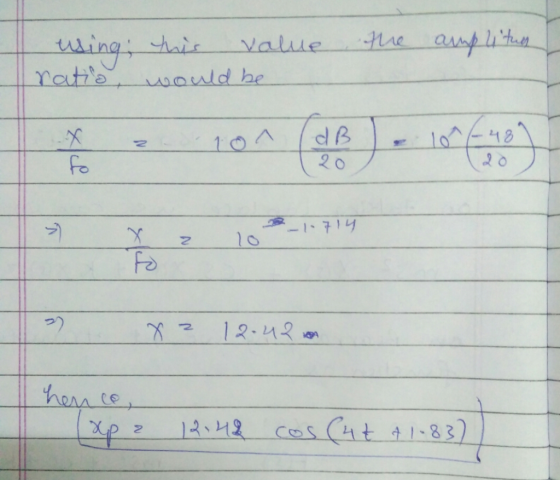
A bode plot of the transfer function, GS = - 25 $2+45+25, is shown as below....
 A bode plot of the transfer function, GS = - 25 $2+45+25, is shown as below. Bode Diagram System sys Frequency (rad/s): 7 Magnitude (dB): -3.4 Magnitude (dB) Phase (deg) Systemt sys Frequency (rad/s): 7 Phase (deg): - 130 - 135 - 180 10 Frequency (rad/s) Determine the frequency response y(t) when a sinusoidal function, X(t) = 10 sin (7t +30) is applied to the transfer function as an input signal. (20 points)
B Frequency Response Modeling Frequency response modeling of a linear system is based on the prem...
 Please explain every step as clearly and detailed as
possible.
B Frequency Response Modeling Frequency response modeling of a linear system is based on the premise that the dynamics of a linear system can be recovered from a knowledge of how the system responds to sinusoidal inputs. (This will be made mathematically precise in Theorem 13.) In other words, to determine (or iden- tify) a linear system, all one has to do is observe how the system reacts to sinusoidal...
Please explain every step as clearly and detailed as
possible.
B Frequency Response Modeling Frequency response modeling of a linear system is based on the premise that the dynamics of a linear system can be recovered from a knowledge of how the system responds to sinusoidal inputs. (This will be made mathematically precise in Theorem 13.) In other words, to determine (or iden- tify) a linear system, all one has to do is observe how the system reacts to sinusoidal...
5. Draw the magnitude characteristic of the Bode plot of the following transfer function: H(s)10(10s +11...
 5. Draw the magnitude characteristic of the Bode plot of the following transfer function: H(s)10(10s +11 (S + 200)2 Identify the poles and zeros Sketch the magnitude plot. The y-axis should be in dB. The x-axis should logarithmic, but labeled in rad/sec e) f) g) Use MATLAB to draw the complete Bode plot and check your answer. h) If the input current is VIN(t)-10 cos(t+35"),what is the output voltage. Use your MATLAB Bode plot to answer this.
singal and system QUESTION 5 [20 marks] Given transfer function of a networks H(s) transfer function...
 singal and
system
QUESTION 5 [20 marks] Given transfer function of a networks H(s) transfer function at w = 1000 rad/s. $10+ 52 +10005+7x10⁶ - Evaluate the [10 marks) b) Simplify and obtain the frequency response (magnitude and phase plots) of the 100(5+10) following transfer function H(s) s+10000 [6 marks] Sketch the magnitude and phase plots from (b) using Bode Plot Technique. [4 marks]
singal and
system
QUESTION 5 [20 marks] Given transfer function of a networks H(s) transfer function at w = 1000 rad/s. $10+ 52 +10005+7x10⁶ - Evaluate the [10 marks) b) Simplify and obtain the frequency response (magnitude and phase plots) of the 100(5+10) following transfer function H(s) s+10000 [6 marks] Sketch the magnitude and phase plots from (b) using Bode Plot Technique. [4 marks]
I really confused as to how I am supposed to do bode approximations? For the following...
 I really confused as to how I am supposed to do bode
approximations?
For the following transfer functions, assume that s-'ω; ω is the angular frequency in radians second. a) Use bode approximations, and plot both magnitude and phase response of the following complex functions Report the bode plots.. b) Use MATLAB or your TI-calculator or any other software package available and plot both magnitude and phase response Compare your simulated results with the bode approximations you got from a)....
I really confused as to how I am supposed to do bode
approximations?
For the following transfer functions, assume that s-'ω; ω is the angular frequency in radians second. a) Use bode approximations, and plot both magnitude and phase response of the following complex functions Report the bode plots.. b) Use MATLAB or your TI-calculator or any other software package available and plot both magnitude and phase response Compare your simulated results with the bode approximations you got from a)....
3. Plot the transient, steady state, and complete response of the capacitor voltage Vc for Ost...
 3. Plot the transient, steady state, and complete response of the capacitor voltage Vc for Ost s 5 seconds. 2 0 t-0 6 0 5 V 10 V
 The transfer function of the given physical system is 2500 Gp(s)-T-1000 Part 3 1. Frequency response (a) Draw the bode plot of open-loop transfer function when K (b) Use bode plot of open-loop transfer function to determine the type of system (do not use transfer function) (c) For what input the system will have constant steady-state error (d) for the unit input in item (c) calculate the constant steady-state error.(Use bode plot to calculate the error.) (e) Design a lead...
 4. Draw the magnitude characteristic of the Bode plot of the following transfer function: 10s H (s) =-= (s+1)(s+102 L7n Identify the poles and zeros Sketch the magnitude plot. The y-axis should be in dB. The x-axis should logarithmic, but labeled in rad/sec Use MATLAB to draw the complete Bode plot and check your answer. If the input current is un(t) = 2 cos(20t + 5°), what is the output voltage. Use your MATLAB Bode plot to answer this a)...
 QUESTION 2 Consider this 2" order transfer function which was discussed in lecture G(s) 10s+9 The Bode plots (magnitude, phase) for this G(s) are provided in this handout. For the following frequency (i.e."o") values, do complex number calculations as performed in lecture, to verify that this magnitude curve (in decibels) and phase curve (in degrees) are correct “o',-0.03, 0.2, 1, 6, 20, and 60 rad/sec Be sure to show your work CLEARLY, and indicate on the Bode plots the magnitude/phase...
 Problem 4: (30) From the given Bode magnitude diagram, (a) Construct the transfer function G(s). 1), find the steady-state response y (b) If input utos(0.l ) The slope of 20logolG jo) at ω < 0.-the slope of 2010giolG jo) at 0.1 < ω < I The slope of 201°golG jo) at ω > 4000-the slope of 2010giolGUo) at 400 < ω < 4000 20log1G(jo) -40 60 80 10 10' 4 10 40 10 400 10 4000 10 w(rad/sec)
Problem 4:...
Problem 4: (30) From the given Bode magnitude diagram, (a) Construct the transfer function G(s). 1), find the steady-state response y (b) If input utos(0.l ) The slope of 20logolG jo) at ω < 0.-the slope of 2010giolG jo) at 0.1 < ω < I The slope of 201°golG jo) at ω > 4000-the slope of 2010giolGUo) at 400 < ω < 4000 20log1G(jo) -40 60 80 10 10' 4 10 40 10 400 10 4000 10 w(rad/sec)
Problem 4:...
 A bode plot of the transfer function, GS = - 25 $2+45+25, is shown as below. Bode Diagram System sys Frequency (rad/s): 7 Magnitude (dB): -3.4 Magnitude (dB) Phase (deg) Systemt sys Frequency (rad/s): 7 Phase (deg): - 130 - 135 - 180 10 Frequency (rad/s) Determine the frequency response y(t) when a sinusoidal function, X(t) = 10 sin (7t +30) is applied to the transfer function as an input signal. (20 points)
 Please explain every step as clearly and detailed as
possible.
B Frequency Response Modeling Frequency response modeling of a linear system is based on the premise that the dynamics of a linear system can be recovered from a knowledge of how the system responds to sinusoidal inputs. (This will be made mathematically precise in Theorem 13.) In other words, to determine (or iden- tify) a linear system, all one has to do is observe how the system reacts to sinusoidal...
Please explain every step as clearly and detailed as
possible.
B Frequency Response Modeling Frequency response modeling of a linear system is based on the premise that the dynamics of a linear system can be recovered from a knowledge of how the system responds to sinusoidal inputs. (This will be made mathematically precise in Theorem 13.) In other words, to determine (or iden- tify) a linear system, all one has to do is observe how the system reacts to sinusoidal...
 5. Draw the magnitude characteristic of the Bode plot of the following transfer function: H(s)10(10s +11 (S + 200)2 Identify the poles and zeros Sketch the magnitude plot. The y-axis should be in dB. The x-axis should logarithmic, but labeled in rad/sec e) f) g) Use MATLAB to draw the complete Bode plot and check your answer. h) If the input current is VIN(t)-10 cos(t+35"),what is the output voltage. Use your MATLAB Bode plot to answer this.
 singal and
system
QUESTION 5 [20 marks] Given transfer function of a networks H(s) transfer function at w = 1000 rad/s. $10+ 52 +10005+7x10⁶ - Evaluate the [10 marks) b) Simplify and obtain the frequency response (magnitude and phase plots) of the 100(5+10) following transfer function H(s) s+10000 [6 marks] Sketch the magnitude and phase plots from (b) using Bode Plot Technique. [4 marks]
singal and
system
QUESTION 5 [20 marks] Given transfer function of a networks H(s) transfer function at w = 1000 rad/s. $10+ 52 +10005+7x10⁶ - Evaluate the [10 marks) b) Simplify and obtain the frequency response (magnitude and phase plots) of the 100(5+10) following transfer function H(s) s+10000 [6 marks] Sketch the magnitude and phase plots from (b) using Bode Plot Technique. [4 marks]
 I really confused as to how I am supposed to do bode
approximations?
For the following transfer functions, assume that s-'ω; ω is the angular frequency in radians second. a) Use bode approximations, and plot both magnitude and phase response of the following complex functions Report the bode plots.. b) Use MATLAB or your TI-calculator or any other software package available and plot both magnitude and phase response Compare your simulated results with the bode approximations you got from a)....
I really confused as to how I am supposed to do bode
approximations?
For the following transfer functions, assume that s-'ω; ω is the angular frequency in radians second. a) Use bode approximations, and plot both magnitude and phase response of the following complex functions Report the bode plots.. b) Use MATLAB or your TI-calculator or any other software package available and plot both magnitude and phase response Compare your simulated results with the bode approximations you got from a)....
 3. Plot the transient, steady state, and complete response of the capacitor voltage Vc for Ost s 5 seconds. 2 0 t-0 6 0 5 V 10 V
Most questions answered within 3 hours.
-
how
much is the energy of co2 per mole increased when it absorbs
infrared radiation with...
asked 28 seconds from now -
which reagent CAN convert the glucose ring into a linear
chain?
a) HCl (aq)
b) H2CrO4...
asked 12 minutes ago -
USING MATLAB.
Design a program which uses a for…end loop to add 10 to
a variable...
asked 13 minutes ago -
The raft is made up of
ten 18 cm diameter logs, each with a length of...
asked 16 minutes ago -
Batteries are one of the major imports of the US from China.
Batteries cost 10 Yuan...
asked 32 minutes ago -
the
Kb of ammonia (NH3) at 25.0 C is 1.75 x 10⁻⁵. Calculate the pH of...
asked 39 minutes ago -
aluminum maker Alcoa has a beta of about 1.86, whereas Hormel
Foods has a beta of...
asked 50 minutes ago -
Hewtex Electronics manufactures two products, headsets and
electronic calculators, and sells them nationally to wholesalers
and...
asked 52 minutes ago -
PHP
Create an HTML Form that asks for a series of
personal information from the user,...
asked 43 minutes ago -
The cash account for American Medical Co. at April 30 indicated
a balance of $10,785. The...
asked 49 minutes ago -
Describe how to measure benefits, including specific examples of
clinical and financial benefits that can be...
asked 1 hour ago -
Costs associated with the manufacture of miniature
high-sensitivity piezoresistive pressure transducers is $74,000 per
year. A...
asked 1 hour ago