Please explain your answer. I will be giving a thumbs down to
all the incorrect answers. Thanks for all your help.
Homework Answers
Answer : 4.5 sigma
A Six Sigma process has a specification limit which is 6 times its sigma (standard deviation) away from its mean. Therefore, a process data point can be 6 standard deviations from the mean and still be acceptable.
In a stable process, the mean naturally shifts as much as 1.5 sigma in the long term on either side of its short-term value. The green lines in Figure 2 (below) show the extreme case of 1.5-sigma mean shift to the right. The right specification limit is at 4.5 sigma from the mean with a defect rate of 3.4 parts per million (PPM). The left specification limit is at 7.5 sigma from the mean with a defect rate of 0 PPM. The overall defect rate, therefore, is 3.4 PPM. A similar argument applies to the extreme case of 1.5-sigma shift to the left. A Six Sigma process is actually 4.5 sigma in the long term, and the 3.4 PPM defect rate is the 1-sided probability of having a data value beyond 4.5 sigma measured from the short-term mean.
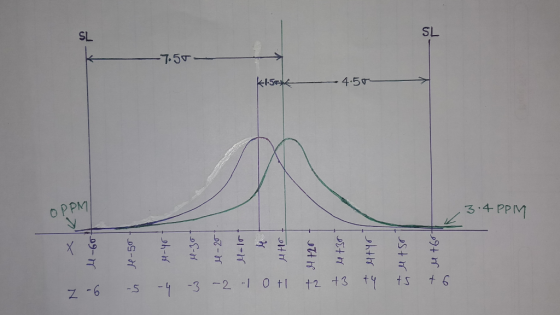
Figure 2: Process Mean Shift of 1.5 Sigma and Defect Rate Corresponding to 4.5 Sigma
The 1.5-sigma shift makes defects approach 0 on the opposite side of the shift even at lower sigma levels. The one-sided defect rate is applicable to any capable process with 1-sided or 2-sided SLs, even at a 3-sigma level.
Add Answer to:
Please explain your answer. I will be giving a thumbs down to all the incorrect answers. Thanks f...
Please explain your answer. I will be giving a thumbs down to all the incorrect answers. Thanks f...
 Please explain your answer. I will be giving a thumbs down to
all the incorrect answers. Thanks for all your help.
The control limits for the C charts are defined by the following. Please check only one answer that apply C +/-The factor A2 from the control chart table * С C+-Three times the population standard deviation divided by the square root of n hree times the square root of C O D3 times C and D4 times C (D3...
Please explain your answer. I will be giving a thumbs down to
all the incorrect answers. Thanks for all your help.
The control limits for the C charts are defined by the following. Please check only one answer that apply C +/-The factor A2 from the control chart table * С C+-Three times the population standard deviation divided by the square root of n hree times the square root of C O D3 times C and D4 times C (D3...
please help with this assignment. please help answer all and explain your answers. if you do...
 please help with this assignment. please help answer
all and explain your answers. if you do I'll be sure to give a
thumbs up asap. thanks
22. The heat production associated with nutrient digestion and metabolism over and above that produced before the food was ingested. Total heat production a. b. Basal metabolism Heat of digestion and absorption c. d. Heat of fermentation e. Heat increment 23. What is the source of pepsinogen? a. Salivary glands b. Gastric mucosa Pancreas...
please help with this assignment. please help answer
all and explain your answers. if you do I'll be sure to give a
thumbs up asap. thanks
22. The heat production associated with nutrient digestion and metabolism over and above that produced before the food was ingested. Total heat production a. b. Basal metabolism Heat of digestion and absorption c. d. Heat of fermentation e. Heat increment 23. What is the source of pepsinogen? a. Salivary glands b. Gastric mucosa Pancreas...
PLEASE ANSWER ALL. I will give thumbs up and leave a good comment if answers are...
 PLEASE ANSWER ALL. I will give thumbs up and leave a good comment
if answers are accurate. NOTE: Please explain clearly in words.
Please be detailed.
The combination of these two carbonyl systems can give an aldol product. Part 1. Will more than one enolate form? Part 2. What kind of base would you use? (NaOH or LDA) Why? Part 3. If you were in the lab running this experiment, which reagent (2,2-dimethylpropanal or phenylacetaldehyde) should you add slowly to...
PLEASE ANSWER ALL. I will give thumbs up and leave a good comment
if answers are accurate. NOTE: Please explain clearly in words.
Please be detailed.
The combination of these two carbonyl systems can give an aldol product. Part 1. Will more than one enolate form? Part 2. What kind of base would you use? (NaOH or LDA) Why? Part 3. If you were in the lab running this experiment, which reagent (2,2-dimethylpropanal or phenylacetaldehyde) should you add slowly to...
Please explain your answers and indicate whether each option is correct or incorrect. Thanks! Select all of the followin...
 Please explain your answers and
indicate whether each option is correct or incorrect. Thanks!
Select all of the following that are true regarding dynamic breathing conditions. During inspiration, intrapleural pressure is less than alveolar pressure AIncorrect B. Correct During expiration, intrapleural pressure becomes more negative than at rest During inspiratory flow, mouth pressure is greaterthan alveolar pressure Compliance is typically lower at TLC than at end of a normal tidal breath
Please explain your answers and
indicate whether each option is correct or incorrect. Thanks!
Select all of the following that are true regarding dynamic breathing conditions. During inspiration, intrapleural pressure is less than alveolar pressure AIncorrect B. Correct During expiration, intrapleural pressure becomes more negative than at rest During inspiratory flow, mouth pressure is greaterthan alveolar pressure Compliance is typically lower at TLC than at end of a normal tidal breath
ANSWER NEEDED IN NEXT 12 HOURS PLEASE. Show all your steps and explain your answers. Thanks!...
 ANSWER NEEDED IN NEXT 12 HOURS PLEASE.
Show all your steps and explain your answers. Thanks!
4 i. Fourier Series for a Rectified Sine Wave Find the Fourier series for a rectified sine wave: (sin 2픈 0<x<들 Plot an approximation to your solution that includes four nonzero terms. Make a histogram of your coefficients
ANSWER NEEDED IN NEXT 12 HOURS PLEASE.
Show all your steps and explain your answers. Thanks!
4 i. Fourier Series for a Rectified Sine Wave Find the Fourier series for a rectified sine wave: (sin 2픈 0<x<들 Plot an approximation to your solution that includes four nonzero terms. Make a histogram of your coefficients
(Please read the question carefully and Answer all otherwise thumbs will be down) 2. (a) Draw...
 (Please read the question carefully and Answer all
otherwise thumbs will be down)
2. (a) Draw the structure of a Dye-sensitized solar cell. Label all components, describe the function of each component and explain the operating principle correlating the structure (b) Explain two major issues of DSSC
(Please read the question carefully and Answer all
otherwise thumbs will be down)
2. (a) Draw the structure of a Dye-sensitized solar cell. Label all components, describe the function of each component and explain the operating principle correlating the structure (b) Explain two major issues of DSSC
Please help me answer this question fully and correctly. Please provide all your work and explain...
 Please help me answer this question fully and
correctly. Please provide all your work and explain your steps so
that I can try and learn to solve the problem. If you do not answer
the question fully, I will thumbs down. Thank you in
advance!!!!
M we have a signal s(t) ={ 10- for ris10 0otherwise (a) Find and sketch the Fourier transform S(f) (b) Find and sketch the Fourier transform U(f) of u(t)-s(t) sin(1000πt). ( sketch real and imaginary...
Please help me answer this question fully and
correctly. Please provide all your work and explain your steps so
that I can try and learn to solve the problem. If you do not answer
the question fully, I will thumbs down. Thank you in
advance!!!!
M we have a signal s(t) ={ 10- for ris10 0otherwise (a) Find and sketch the Fourier transform S(f) (b) Find and sketch the Fourier transform U(f) of u(t)-s(t) sin(1000πt). ( sketch real and imaginary...
Please show all of your work! Thanks in advance and have a good day! I will...
 Please show all of your work! Thanks in advance and have a
good day!
I will be rating thumbs up for best answer !
4. Problem 4 (10 points). For the circuit shown in Fig. 2 what is the initial value and the steady state value of the voltage across the output? Assume the switch closes at t = 0·Explain your answer. R3 R1 R4 R2 Vout Vs 0 V E 1 mH GND
Please show all of your work! Thanks in advance and have a
good day!
I will be rating thumbs up for best answer !
4. Problem 4 (10 points). For the circuit shown in Fig. 2 what is the initial value and the steady state value of the voltage across the output? Assume the switch closes at t = 0·Explain your answer. R3 R1 R4 R2 Vout Vs 0 V E 1 mH GND
PLEASE BOX ALL ANSWERS FOR A THUMBS UP Consider the circuit shown in (Figure 1). Suppose...
 PLEASE BOX ALL ANSWERS FOR A THUMBS UP
Consider the circuit shown in (Figure 1). Suppose that R = 7 kN. Find the current i, in the circuit by making a succession of appropriate source transformations. Express your answer to three significant figures and include the appropriate units. uA ? io = Value Units Submit Previous Answers Request Answer X Incorrect; Try Again; 5 attempts remaining Check your signs. Figure Part B 1 of 1 Work back through the circuit...
PLEASE BOX ALL ANSWERS FOR A THUMBS UP
Consider the circuit shown in (Figure 1). Suppose that R = 7 kN. Find the current i, in the circuit by making a succession of appropriate source transformations. Express your answer to three significant figures and include the appropriate units. uA ? io = Value Units Submit Previous Answers Request Answer X Incorrect; Try Again; 5 attempts remaining Check your signs. Figure Part B 1 of 1 Work back through the circuit...
please answer all and circle the answers!!! i always give thumbs up for correct answers!!! Set...
 please answer all and circle the answers!!! i always give thumbs up
for correct answers!!!
Set up, but do not evaluate, an integral for the area of the surface obtained by rotating the curve y = Inx' about the x-axis on the interval 15x55. a. [ 27x12ct), A1+ (0 dx b. dx C. [ 21(55(x), 1-(3) dx d. ( 27653), 1+ dx e. [2015), (3 dx Determine which one of the p-series below is divergent. a. 1 03 b. X-1...
please answer all and circle the answers!!! i always give thumbs up
for correct answers!!!
Set up, but do not evaluate, an integral for the area of the surface obtained by rotating the curve y = Inx' about the x-axis on the interval 15x55. a. [ 27x12ct), A1+ (0 dx b. dx C. [ 21(55(x), 1-(3) dx d. ( 27653), 1+ dx e. [2015), (3 dx Determine which one of the p-series below is divergent. a. 1 03 b. X-1...
 Please explain your answer. I will be giving a thumbs down to
all the incorrect answers. Thanks for all your help.
The control limits for the C charts are defined by the following. Please check only one answer that apply C +/-The factor A2 from the control chart table * С C+-Three times the population standard deviation divided by the square root of n hree times the square root of C O D3 times C and D4 times C (D3...
Please explain your answer. I will be giving a thumbs down to
all the incorrect answers. Thanks for all your help.
The control limits for the C charts are defined by the following. Please check only one answer that apply C +/-The factor A2 from the control chart table * С C+-Three times the population standard deviation divided by the square root of n hree times the square root of C O D3 times C and D4 times C (D3...
 please help with this assignment. please help answer
all and explain your answers. if you do I'll be sure to give a
thumbs up asap. thanks
22. The heat production associated with nutrient digestion and metabolism over and above that produced before the food was ingested. Total heat production a. b. Basal metabolism Heat of digestion and absorption c. d. Heat of fermentation e. Heat increment 23. What is the source of pepsinogen? a. Salivary glands b. Gastric mucosa Pancreas...
please help with this assignment. please help answer
all and explain your answers. if you do I'll be sure to give a
thumbs up asap. thanks
22. The heat production associated with nutrient digestion and metabolism over and above that produced before the food was ingested. Total heat production a. b. Basal metabolism Heat of digestion and absorption c. d. Heat of fermentation e. Heat increment 23. What is the source of pepsinogen? a. Salivary glands b. Gastric mucosa Pancreas...
 PLEASE ANSWER ALL. I will give thumbs up and leave a good comment
if answers are accurate. NOTE: Please explain clearly in words.
Please be detailed.
The combination of these two carbonyl systems can give an aldol product. Part 1. Will more than one enolate form? Part 2. What kind of base would you use? (NaOH or LDA) Why? Part 3. If you were in the lab running this experiment, which reagent (2,2-dimethylpropanal or phenylacetaldehyde) should you add slowly to...
PLEASE ANSWER ALL. I will give thumbs up and leave a good comment
if answers are accurate. NOTE: Please explain clearly in words.
Please be detailed.
The combination of these two carbonyl systems can give an aldol product. Part 1. Will more than one enolate form? Part 2. What kind of base would you use? (NaOH or LDA) Why? Part 3. If you were in the lab running this experiment, which reagent (2,2-dimethylpropanal or phenylacetaldehyde) should you add slowly to...
 Please explain your answers and
indicate whether each option is correct or incorrect. Thanks!
Select all of the following that are true regarding dynamic breathing conditions. During inspiration, intrapleural pressure is less than alveolar pressure AIncorrect B. Correct During expiration, intrapleural pressure becomes more negative than at rest During inspiratory flow, mouth pressure is greaterthan alveolar pressure Compliance is typically lower at TLC than at end of a normal tidal breath
Please explain your answers and
indicate whether each option is correct or incorrect. Thanks!
Select all of the following that are true regarding dynamic breathing conditions. During inspiration, intrapleural pressure is less than alveolar pressure AIncorrect B. Correct During expiration, intrapleural pressure becomes more negative than at rest During inspiratory flow, mouth pressure is greaterthan alveolar pressure Compliance is typically lower at TLC than at end of a normal tidal breath
 ANSWER NEEDED IN NEXT 12 HOURS PLEASE.
Show all your steps and explain your answers. Thanks!
4 i. Fourier Series for a Rectified Sine Wave Find the Fourier series for a rectified sine wave: (sin 2픈 0<x<들 Plot an approximation to your solution that includes four nonzero terms. Make a histogram of your coefficients
ANSWER NEEDED IN NEXT 12 HOURS PLEASE.
Show all your steps and explain your answers. Thanks!
4 i. Fourier Series for a Rectified Sine Wave Find the Fourier series for a rectified sine wave: (sin 2픈 0<x<들 Plot an approximation to your solution that includes four nonzero terms. Make a histogram of your coefficients
 (Please read the question carefully and Answer all
otherwise thumbs will be down)
2. (a) Draw the structure of a Dye-sensitized solar cell. Label all components, describe the function of each component and explain the operating principle correlating the structure (b) Explain two major issues of DSSC
(Please read the question carefully and Answer all
otherwise thumbs will be down)
2. (a) Draw the structure of a Dye-sensitized solar cell. Label all components, describe the function of each component and explain the operating principle correlating the structure (b) Explain two major issues of DSSC
 Please help me answer this question fully and
correctly. Please provide all your work and explain your steps so
that I can try and learn to solve the problem. If you do not answer
the question fully, I will thumbs down. Thank you in
advance!!!!
M we have a signal s(t) ={ 10- for ris10 0otherwise (a) Find and sketch the Fourier transform S(f) (b) Find and sketch the Fourier transform U(f) of u(t)-s(t) sin(1000πt). ( sketch real and imaginary...
Please help me answer this question fully and
correctly. Please provide all your work and explain your steps so
that I can try and learn to solve the problem. If you do not answer
the question fully, I will thumbs down. Thank you in
advance!!!!
M we have a signal s(t) ={ 10- for ris10 0otherwise (a) Find and sketch the Fourier transform S(f) (b) Find and sketch the Fourier transform U(f) of u(t)-s(t) sin(1000πt). ( sketch real and imaginary...
 Please show all of your work! Thanks in advance and have a
good day!
I will be rating thumbs up for best answer !
4. Problem 4 (10 points). For the circuit shown in Fig. 2 what is the initial value and the steady state value of the voltage across the output? Assume the switch closes at t = 0·Explain your answer. R3 R1 R4 R2 Vout Vs 0 V E 1 mH GND
Please show all of your work! Thanks in advance and have a
good day!
I will be rating thumbs up for best answer !
4. Problem 4 (10 points). For the circuit shown in Fig. 2 what is the initial value and the steady state value of the voltage across the output? Assume the switch closes at t = 0·Explain your answer. R3 R1 R4 R2 Vout Vs 0 V E 1 mH GND
 PLEASE BOX ALL ANSWERS FOR A THUMBS UP
Consider the circuit shown in (Figure 1). Suppose that R = 7 kN. Find the current i, in the circuit by making a succession of appropriate source transformations. Express your answer to three significant figures and include the appropriate units. uA ? io = Value Units Submit Previous Answers Request Answer X Incorrect; Try Again; 5 attempts remaining Check your signs. Figure Part B 1 of 1 Work back through the circuit...
PLEASE BOX ALL ANSWERS FOR A THUMBS UP
Consider the circuit shown in (Figure 1). Suppose that R = 7 kN. Find the current i, in the circuit by making a succession of appropriate source transformations. Express your answer to three significant figures and include the appropriate units. uA ? io = Value Units Submit Previous Answers Request Answer X Incorrect; Try Again; 5 attempts remaining Check your signs. Figure Part B 1 of 1 Work back through the circuit...
 please answer all and circle the answers!!! i always give thumbs up
for correct answers!!!
Set up, but do not evaluate, an integral for the area of the surface obtained by rotating the curve y = Inx' about the x-axis on the interval 15x55. a. [ 27x12ct), A1+ (0 dx b. dx C. [ 21(55(x), 1-(3) dx d. ( 27653), 1+ dx e. [2015), (3 dx Determine which one of the p-series below is divergent. a. 1 03 b. X-1...
please answer all and circle the answers!!! i always give thumbs up
for correct answers!!!
Set up, but do not evaluate, an integral for the area of the surface obtained by rotating the curve y = Inx' about the x-axis on the interval 15x55. a. [ 27x12ct), A1+ (0 dx b. dx C. [ 21(55(x), 1-(3) dx d. ( 27653), 1+ dx e. [2015), (3 dx Determine which one of the p-series below is divergent. a. 1 03 b. X-1...
Most questions answered within 3 hours.
-
A 0.0510 M solution of an organic acid has an
[H+] of 7.50×10⁻⁴M .
What is...
asked 18 seconds from now -
The completed Lewis structure of CO2 contains a total
of 0,1,2,3,4,5,6,7,8 covalent bonds
and 0,1,2,3,4,5,6,7,8 lone pairs.
NOTE:...
asked 2 minutes ago -
what is the profit-maximizing output condition that a
monopolistically competitive firm must satisfy? a) price charged...
asked 4 minutes ago -
Consider the set of ordered pairs shown below. Assuming that the
regression equation is y=3.513+0.429x and...
asked 25 minutes ago -
1. (A) Write two
structural (constitutional)
isomers of C4H8F2?
Please show all of
the
asked 27 minutes ago -
Objective: Practice converting a Boolean logic
expression into it’s truth table and to show the implementation...
asked 24 minutes ago -
1) Name the three holes located in the greater wing of the
sphenoid bone in order...
asked 28 minutes ago -
For the following reaction set-up, which type of hydrocarbon
product would form? 1,4-hexadiene + two Cl2...
asked 31 minutes ago -
Consider the following method that is intended to determine if
the double values d1 and d2...
asked 43 minutes ago -
could someone please post clear drawings of the three structures
in the equilibrium mixture of D-glucose...
asked 50 minutes ago -
Using the Properties of Order show that 5n5 +
4n4 + 6n3 + 2n2+ n +...
asked 53 minutes ago -
What is experiential learning and how is it helpful for teaching
leadership, and interpreting group dynamics?...
asked 53 minutes ago