
Homework Answers
Minitab output 
![Minitab - Untitled [Session] File Edit Data Cal Stat Graph Editor Tools Window Help Assistant 비 訕ㄧˊ一ㄧ啗1 0-1E t ↓ 盖彪 LO@国 쿄 ⓘ翌](http://img.homeworklib.com/images/115d48fe-3168-491e-ba7f-105b78b057fd.png?x-oss-process=image/resize,w_560) plot of regression line
overlaid with the sample data points
plot of regression line
overlaid with the sample data points
 plot of residuals vs
x
plot of residuals vs
x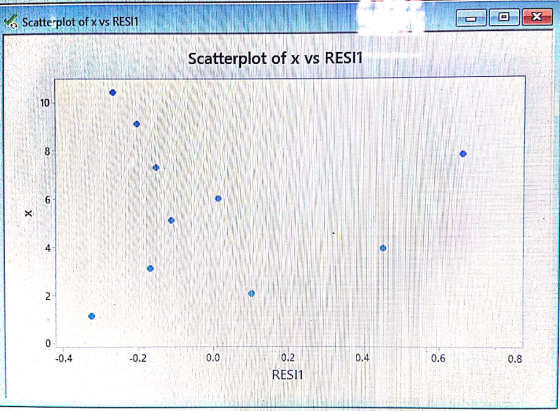
The above solution is correct with full explaination so please rate me high.
Add Answer to:
Group Assignment #8-Linear regression review You have the following sample data for y (dependent ...
Bivariate data for the quantitative variables x and y are given in the table below. These...
 Bivariate data for the quantitative variables x and y are given in the table below. These data are plotted in the scatter plot shown next to the table. In the scatter plot, sketch an approximation of the least squares regression line for the data. y 3.4 4.8 11+ 10+ х ? 3.2 5.9 4.4 3 8.7 6.4 2.7 10.5 5.1 7.6 7.3 6.2 2.8 5.5 1.4 6.6 7.0 6.9 5.8 5.7 3.2 8.1 6.2 4.2 5.2 9.5 2.2
Saved 2023 A sample of 100 bank customer waiting times are given in the following table:...
 Saved 2023 A sample of 100 bank customer waiting times are given in the following table: Waiting Times (in Minutes) for the Bank Custoner Waiting Tine Case 4.5 9.7 11.8 10.4 4.2 7.e 5.5 8.7 8.8 5.1 5.4 4.5 6.2 3.9 8.7 7.6 4.7 4.0 4.0 10.1 .3 2.8 5.4 6.5 9.7 5.2 7.0 5.8 4.5 8.2 1.9 5.2 4.1 7.9 5.3 8.8 6.2 4.1 4.1 4.5 10.4 .2 7.0 6.8 5.5 8.3 11.3 5.9 8.8 2.8 6.7 5.5 5.e...
The data on the below shows the number of hours a particular drug is in the...
The data on the below shows the number of hours a particular drug is in the system of 200 females. Develop a histogram of this data according to the following intervals: Follow the directions. Test the hypothesis that these data are distributed exponentially. Determine the test statistic. Round to two decimal places. (sort the data first) [0, 3) [3, 6) [6, 9) [9, 12) [12, 18) [18, 24) [24, infinity) 34.7 11.8 10 7.8 2.8 20 9.8 20.4 1.2 7.2...
Compute Regression Analysis for following relationship: The relationship between death rate X1 (USD) vs. population density...
Compute Regression Analysis for following relationship: The relationship between death rate X1 (USD) vs. population density X5. Population as a Predictor, X, then death rate as a Response variable, Y. Get Regression Output, and Scatter plot between these variables and compute Coefficient of Determination, R2, and Interpret your findings. X1 X2 X3 X4 X5 The data (X1, X2, X3, X4, X5) are by city. 8 78 284 9.1 109 X1 = death rate per 1000 residents 9.3 68 433 8.7 144...
11.38 Building a multiple linear regression model. Let’s now build a model to predict the life-satisfaction...
11.38 Building a multiple linear regression model. Let’s now build a model to predict the life-satisfaction score, LSI. (a) Consider a simple linear regression using GINI as the explanatory variable. Run the regression and summarize the results. Be sure to check assumptions. (b) Now consider a model using GINI and LIFE. Run the multiple regression and summarize the results. Again be sure to check assumptions. (c) Now consider a model using GINI, LIFE, and DEMOCRACY. Run the multiple regression and...
An object of weight 1 N is falling vertically. The time vs. speed data can be...
An object of weight 1 N is falling vertically. The time vs. speed data can be found here. In this case the effect of air-drag cannot be neglected. Use your critical thinking to estimate the air-drag coefficient . Make sure you include the units in your answer. 0 0 0.1 0.9992 0.2 1.993 0.3 2.978 0.4 3.948 0.5 4.898 0.6 5.826 0.7 6.728 0.8 7.599 0.9 8.438 1 9.242 1.1 10.01 1.2 10.74 1.3 11.43 1.4 12.09 1.5 12.7 1.6 ...
Decide (with short explanations) whether the following statements are true or false. e) In a simple linear regression model with explanatory variable x and outcome variable y, we have these summary s...
 Decide (with short explanations) whether the following
statements are true or false.
e) In a simple linear regression model with explanatory variable x and outcome variable y, we have these summary statisties z-10, s/-3 sy-5 and у-20. For a new data point with x = 13, it is possible that the predicted value is y = 26. f A standard multiple regression model with continuous predictors and r2, a categorical predictor T with four values, an interaction between a and...
Decide (with short explanations) whether the following
statements are true or false.
e) In a simple linear regression model with explanatory variable x and outcome variable y, we have these summary statisties z-10, s/-3 sy-5 and у-20. For a new data point with x = 13, it is possible that the predicted value is y = 26. f A standard multiple regression model with continuous predictors and r2, a categorical predictor T with four values, an interaction between a and...
Compute the correlation coefficient, r, for all five variables (columns). Interpret your findings whether you have determined any relationship between variables. X1 X2 X3 X4 X5 The data (X1, X...
Compute the correlation coefficient, r, for all five variables (columns). Interpret your findings whether you have determined any relationship between variables. X1 X2 X3 X4 X5 The data (X1, X2, X3, X4, X5) are by city. 8 78 284 9.1 109 X1 = death rate per 1000 residents 9.3 68 433 8.7 144 X2 = doctor availability per 100,000 residents 7.5 70 739 7.2 113 X3 = hospital availability per 100,000 residents 8.9 96 1792 8.9 97 X4 = annual...
The data contained in the file named StateUnemp show the unemployment rate in March 2011 and...
The data contained in the file named StateUnemp show the unemployment rate in March 2011 and the unemployment rate in March 2012 for every state.† State Unemploy- ment Rate March 2011 Unemploy- ment Rate March 2012 Alabama 9.3 7.3 Alaska 7.6 7.0 Arizona 9.6 8.6 Arkansas 8.0 7.4 California 11.9 11.0 Colorado 8.5 7.8 Connecticut 9.1 7.7 Delaware 7.3 6.9 Florida 10.7 ...
The well-known psychologist Dr. Elbod has established what he calls his Generalized Anxiety Scale (GAS). The...
 The well-known psychologist Dr. Elbod has established what he calls his Generalized Anxiety Scale (GAS). The GAS, which is a scale from 0 to 10, measures the "general anxiety" of an individual, with higher GAS scores corresponding to more anxiety. (Dr. Elbod's assessment of anxiety is based on a variety of measurements, both physiological and psychological.) we're interested in making predictions about individuals' sleep behavior based on their GAS scores. The bivarlate data below give the GAS score (denoted by...
 Bivariate data for the quantitative variables x and y are given in the table below. These data are plotted in the scatter plot shown next to the table. In the scatter plot, sketch an approximation of the least squares regression line for the data. y 3.4 4.8 11+ 10+ х ? 3.2 5.9 4.4 3 8.7 6.4 2.7 10.5 5.1 7.6 7.3 6.2 2.8 5.5 1.4 6.6 7.0 6.9 5.8 5.7 3.2 8.1 6.2 4.2 5.2 9.5 2.2
 Saved 2023 A sample of 100 bank customer waiting times are given in the following table: Waiting Times (in Minutes) for the Bank Custoner Waiting Tine Case 4.5 9.7 11.8 10.4 4.2 7.e 5.5 8.7 8.8 5.1 5.4 4.5 6.2 3.9 8.7 7.6 4.7 4.0 4.0 10.1 .3 2.8 5.4 6.5 9.7 5.2 7.0 5.8 4.5 8.2 1.9 5.2 4.1 7.9 5.3 8.8 6.2 4.1 4.1 4.5 10.4 .2 7.0 6.8 5.5 8.3 11.3 5.9 8.8 2.8 6.7 5.5 5.e...
 Decide (with short explanations) whether the following
statements are true or false.
e) In a simple linear regression model with explanatory variable x and outcome variable y, we have these summary statisties z-10, s/-3 sy-5 and у-20. For a new data point with x = 13, it is possible that the predicted value is y = 26. f A standard multiple regression model with continuous predictors and r2, a categorical predictor T with four values, an interaction between a and...
Decide (with short explanations) whether the following
statements are true or false.
e) In a simple linear regression model with explanatory variable x and outcome variable y, we have these summary statisties z-10, s/-3 sy-5 and у-20. For a new data point with x = 13, it is possible that the predicted value is y = 26. f A standard multiple regression model with continuous predictors and r2, a categorical predictor T with four values, an interaction between a and...
 The well-known psychologist Dr. Elbod has established what he calls his Generalized Anxiety Scale (GAS). The GAS, which is a scale from 0 to 10, measures the "general anxiety" of an individual, with higher GAS scores corresponding to more anxiety. (Dr. Elbod's assessment of anxiety is based on a variety of measurements, both physiological and psychological.) we're interested in making predictions about individuals' sleep behavior based on their GAS scores. The bivarlate data below give the GAS score (denoted by...
Most questions answered within 3 hours.
-
Ayesha’s adjusted gross income is $60,000 in 2019. She donated a
piece of artwork with a...
asked 2 minutes ago -
For Dijkstra’s shortest path algorithm:
a. Give the Big-O time for Dijkstra’s shortest path algorithm
and...
asked 15 minutes ago -
Phosphorus violates the 'octet rule' in biological molecules,
forming more covalent bonds than expected based on...
asked 18 minutes ago -
A 1.3 eV electron has a 10-4 probability of tunneling
through a 2.4 eV potential barrier....
asked 36 minutes ago -
What is the one ingredient that is common to being successful
with all stakeholders?
profit
trust...
asked 35 minutes ago -
Write an assembly language 32 bit program that reads in lines of
text by a .txt...
asked 38 minutes ago -
what is the density ( in g/L) of hydrogen gas at 29 degrees C and a...
asked 46 minutes ago -
5-6. You are considering three investment alternatives for some
spare cash: Old Reliable Corporation stock (A1),...
asked 38 minutes ago -
Problem 16-02
Receivables Investment
Medwig Corporation has a DSO of 45 days. The company averages
$7,250...
asked 53 minutes ago -
Mr. Brown hired Lowe's Maintenance Services Limited to repair
and paint the exterior wall of his...
asked 54 minutes ago -
When might an index slow down the overall performance of the
database? Choose the best answer....
asked 59 minutes ago -
Due to a recession, expected inflation this year is only 2.25%.
However, the inflation rate in...
asked 1 hour ago