I have to submit a term paper which involves conducting a regression and correlation analysis on ...
I have to submit a term paper which involves conducting a regression and correlation analysis on any topic of my choosing. The paper must be based on yearly data for any economic or business variable, for a period of at least 20 years. The following also must be included in the paper: • The term paper should distinguish between dependent and independent variables; determine the regression equation by the least squares method; plot the regression line on a scatter diagram; interpret the meaning of regression coefficients; use the regression equation to predict values of the dependent variable for selected values of the independent variable and construct forecast intervals and calculate the standard error of estimate, coefficients of determination (r2) and correlation (r) and interpret the meaning of the coefficients (r2) and (r). Your regression and correlation analysis must: 1. Graph the data (scatter diagram) 2. Use the method of least squares to derive a trend equation and trend values 3. Use check column to verify computations ∑ (Y-Yc)=0 4. Superimpose trend equation on scatter diagram. 5. Use your model to predict the movement of the variable for the next year. 6. Compare your predictions with the actual behavior of the variable during the 21styear . I am stumped on what topic to choose and that is where I am looking for guidance. Any help would be greatly appreciated.
Homework Answers
A good way to start might be to model the relationship with a linear equation, Y = mX + b, where m is the slope of the line and b is the Y-intercept, as you learned in high school algebra. The question now is to determine the best way to estimate m and be given your pairs of X's and Y's.
It turns out that the best way to do this is to use least squares regression. We call it least squares regression because the line that we choose will be the one for which the sum of the squares of the differences between predicted and observed values is as small as possible.
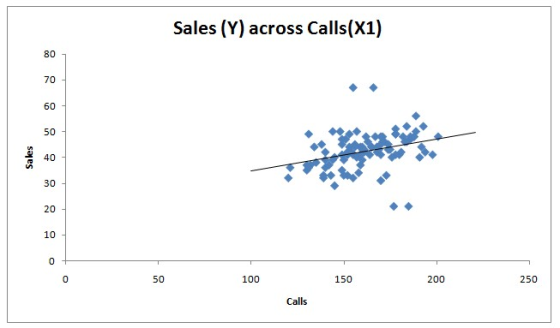
1. Scatter Plot of Y and X1
Scatter plot of sales and calls shows that there can be a linear trend between the both. The trendline indicates that it looks like higher the number of calls, higher will be sales
2. Best fit line
Using the Regression option in Excel Data analysis menu, we obtaain the following output

From this, bestfit line equation is Sales=Intercept+Coefficient of Calls *Calls
i.e., Sales = 22.52 + 0.1237 * Calls
3. Coefficient of Correlation
It denotes the strength of association between two variables. The sign denotes the direction of association.
In Exel, we calculate Correlation coefficient as Correl(X1array,Yarray)
We get the value as 0.318
This means that calls and sales are slightly positively associated. With increase in one quantiity, the other is also showing an increasing trend. Please note that this does not imply causation, i.e.,we CANNOT say that the rise or fall in one is causing the change in other.
4. Coefficient of Determination
It is more commonly known as R squared value. It gives the measure of how close the data points are to the best fit line. In other words, it gives the proportion of variability in dependent variable that can be explained by the independent variable. Higher the Rsquared value, better the model is.
From Excel regression output, we get R squared value or Coefficient of Determination as 0.101
~10% of variability in sales is explained by calls.

5. Utility of Regression model
F test can be used to test the utility of the model.
Null Hypothesis: Beta coefficient of call = 0; i.e., Calls is NOT linearly associated with sales
Alternate Hypothesis: Beta coefficient of call 
Let us choose significance level, 
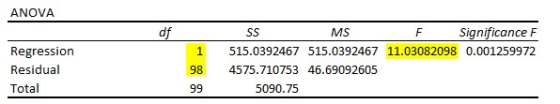
From the regression ANOVA output, we get p value (or significance value) of F test as 0.0012 (<0.05) for the given degrees of freedom (highlighted)
Since p value < 
6. Based on the above findings, it can be said that calls is a good and important variable in predicting sales volume. It has been proved that calls and sales have a positive linear association between them. From the best fit line (Sales = 22.52 + 0.1237 * Calls), we can say that with every call, sales increases by 0.1237units (interpretation of coefficient of calls).
7. 95% Confidence Interval

The 95% confidence interval for the coefficient of Calls
(
Interpretation: 95% confidence interval means that if this
regression analysis is to be repeated for other samples from
population, 95% of the intervals will contain the true value of


Add Answer to:
I have to submit a term paper which involves conducting a regression and correlation analysis on ...
A study was conducted to analyze whether there is a linear relation between the number of customers
 A study was conducted to analyze whether there is a linear relation between the number of customers who visited a store and the total sales at that store. The following data was collected over a period of 14 days(a) What is the dependent and independent variable? (b) Prepare a scatter plot. What is the direction of correlation?(c) What is the equation of the regression line? d) What is the coefficient of determination (r) and interpret the meaning of it. (e) Calculate the correlation coefficient...
13.76 You want to develop a model to predict the selling price of homes based on assessed value. A sample of 30 recently sold single-family houses in a small city is selected to study the relatio...
 13.76 You want to develop a model to predict the selling price of homes based on assessed value. A sample of 30 recently sold single-family houses in a small city is selected to study the relationship between selling price (in thousands of dollars) and assessed value (in thousands of dollars). The houses in the city were reassessed at full value one year prior to the study. The results are in House 1. (Hint: First, determine which are the independent and...
The β 1 term indicates a. the Y value for a given value of X. b....
The β 1 term indicates a. the Y value for a given value of X. b. the average change in Y for a unit change in X. c. the Y value when X equals zero. d. the change in observed X for a given change in Y. What does regression analysis attempt to establish? a. linearity in the relationship between independent variables b. a mathematical relationship between a dependent variable, for which future values will be forecast, and one or...
Question 6 (10 marks) Finally, the researcher considers using regression analysis to establish a linear relationship...
Question 6 (10 marks) Finally, the researcher considers using regression analysis to establish a linear relationship between the two variables – hours worked per week and yearly income. a) What is the dependent variable and independent variable for this analysis? Why? (2 marks) b) Use an appropriate plot to investigate the relationship between the two variables. Display the plot. On the same plot, fit a linear trend line including the equation and the coefficient of determination R2 . (2 marks)...
Please explain in detail and provide answers Linear Regression & Correlation Coefficient Practice Would you consider...
 Please explain in detail and provide answers
Linear Regression & Correlation Coefficient Practice Would you consider the data to be accurate, precise or both? Justify. 1. 10 T 2. The table below shows the percentage of females in the U.S. labor force at various times throughout history Years after 1900 | 50 Percentage | 60 T70- T80-T90 8.1 42.5 45.3 100 52.0 Enter the data into your calculator or excel and give the equation. Round slope & y-intercept to 2...
Please explain in detail and provide answers
Linear Regression & Correlation Coefficient Practice Would you consider the data to be accurate, precise or both? Justify. 1. 10 T 2. The table below shows the percentage of females in the U.S. labor force at various times throughout history Years after 1900 | 50 Percentage | 60 T70- T80-T90 8.1 42.5 45.3 100 52.0 Enter the data into your calculator or excel and give the equation. Round slope & y-intercept to 2...
Chapter 12 Project: Linear Regression and Correlation Student Learning Outcomes: • The student will calculate and...
 Chapter 12 Project: Linear Regression and Correlation Student Learning Outcomes: • The student will calculate and construct the line of best fit between two variables. • The student will evaluate the relationship between two variables to determine if that relationship is significant Data The table below gives total fuel efficiency (in miles per gallon) and mass (in kilograms) of 20 new model cars with automatic transmissions. We will use this data to determine the relationship, if any, between the fuel...
Which of the following statements regarding regression and correlation are true? (There may be more than...
Which of the following statements regarding regression and correlation are true? (There may be more than one correct answer.) a. If the linear correlation between two variables is 0, then there is no relationship between the two variables. b. When the slope of a linear regression equation is near 0, then the linear correlation between the two variables must also be near 0. c. The average error between the actual values and the predicted values of a least squares line...
a. Develop a scatter plot with HRS1 (how many hours per week one works) as the...
a. Develop a scatter plot with HRS1 (how many hours per week one works) as the dependent variable and age as the independent variable. Include the estimated regression equation and the coefficient of determination on your scatter plot. [ 1.5 points] b. Does there appear to be a relationship between these variables (HRS1 and age)? Briefly explain and justify your answer.[ 1 point] c. Calculate the slope (b1) and intercept (b0) coefficients and use them to develop an estimated regression...
Which of the following statements regarding regression and correlation are true? (There may be more than...
Which of the following statements regarding regression and correlation are true? (There may be more than one correct answer.) a. A value of the linear correlation, r, near -1 means the data is tightly bundled around a line, and predictions within the scope of data are very reliable. b. When the slope of a linear regression equation is near 0, then the linear correlation between the two variables must also be near 0. c. The average error between the actual...
 13.76 You want to develop a model to predict the selling price of homes based on assessed value. A sample of 30 recently sold single-family houses in a small city is selected to study the relationship between selling price (in thousands of dollars) and assessed value (in thousands of dollars). The houses in the city were reassessed at full value one year prior to the study. The results are in House 1. (Hint: First, determine which are the independent and...
 Please explain in detail and provide answers
Linear Regression & Correlation Coefficient Practice Would you consider the data to be accurate, precise or both? Justify. 1. 10 T 2. The table below shows the percentage of females in the U.S. labor force at various times throughout history Years after 1900 | 50 Percentage | 60 T70- T80-T90 8.1 42.5 45.3 100 52.0 Enter the data into your calculator or excel and give the equation. Round slope & y-intercept to 2...
Please explain in detail and provide answers
Linear Regression & Correlation Coefficient Practice Would you consider the data to be accurate, precise or both? Justify. 1. 10 T 2. The table below shows the percentage of females in the U.S. labor force at various times throughout history Years after 1900 | 50 Percentage | 60 T70- T80-T90 8.1 42.5 45.3 100 52.0 Enter the data into your calculator or excel and give the equation. Round slope & y-intercept to 2...
 Chapter 12 Project: Linear Regression and Correlation Student Learning Outcomes: • The student will calculate and construct the line of best fit between two variables. • The student will evaluate the relationship between two variables to determine if that relationship is significant Data The table below gives total fuel efficiency (in miles per gallon) and mass (in kilograms) of 20 new model cars with automatic transmissions. We will use this data to determine the relationship, if any, between the fuel...
Most questions answered within 3 hours.
-
1. What is the meaning of the term communication style?
2. What are the benefits to...
asked 33 minutes ago -
9.) You are buying a car that cost $26,500. You make payments of
$412 each month...
asked 58 minutes ago -
. Suppose a discrete random variable has probability
distribution
P(x) = .2 if x = 0...
asked 2 hours ago -
Problem #1
The area between Z = 0 and Z = 2.50
The area between Z...
asked 1 hour ago -
Under the influence of its drive force, a snowmobile is moving
at a constant velocity along...
asked 2 hours ago -
Why do organizations decline? What steps can top
management take to halt, decline, and restore organizational...
asked 2 hours ago -
What mechanisms Drive speciation??
(I.e. what was Dawins theory on the orgin of species, and how...
asked 4 hours ago -
The manager at a car assembly plant believes that the mean
assembly time for a car...
asked 4 hours ago -
Which of the following is true of electron capture?
A) It decreases the nuclide's mass number...
asked 6 hours ago -
Assuming an efficiency of 43.10%, calculate the actual yield of
magnesium nitrate formed from 114.9 g...
asked 7 hours ago -
The highly pathogenic bacterium Clostridium
perfringens causes gangrene, a disease that results in the
destruction of...
asked 8 hours ago -
In the context of situation analysis, which of the following is
a category for analysis in...
asked 8 hours ago